Fig. 4.
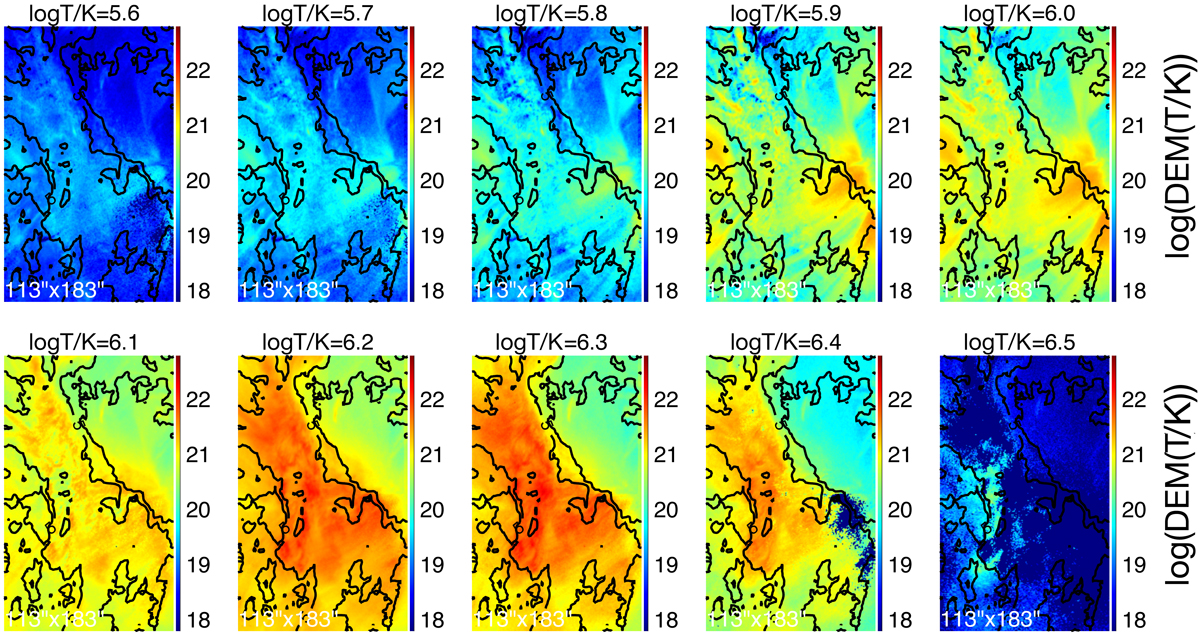
Thermal structure of the upflow region and the active region core for the observation from 15 November. The panels show the DEM map at a temperature range from log T/K = 5.6 to log T/K = 6.5. The FOV is the same as for IRIS raster data (Fig. 2). The contours indicate the ±5 km s−1 plasma flow in the Fe XII line indicating the upflow region and the active region core.
Current usage metrics show cumulative count of Article Views (full-text article views including HTML views, PDF and ePub downloads, according to the available data) and Abstracts Views on Vision4Press platform.
Data correspond to usage on the plateform after 2015. The current usage metrics is available 48-96 hours after online publication and is updated daily on week days.
Initial download of the metrics may take a while.