Fig. 2.
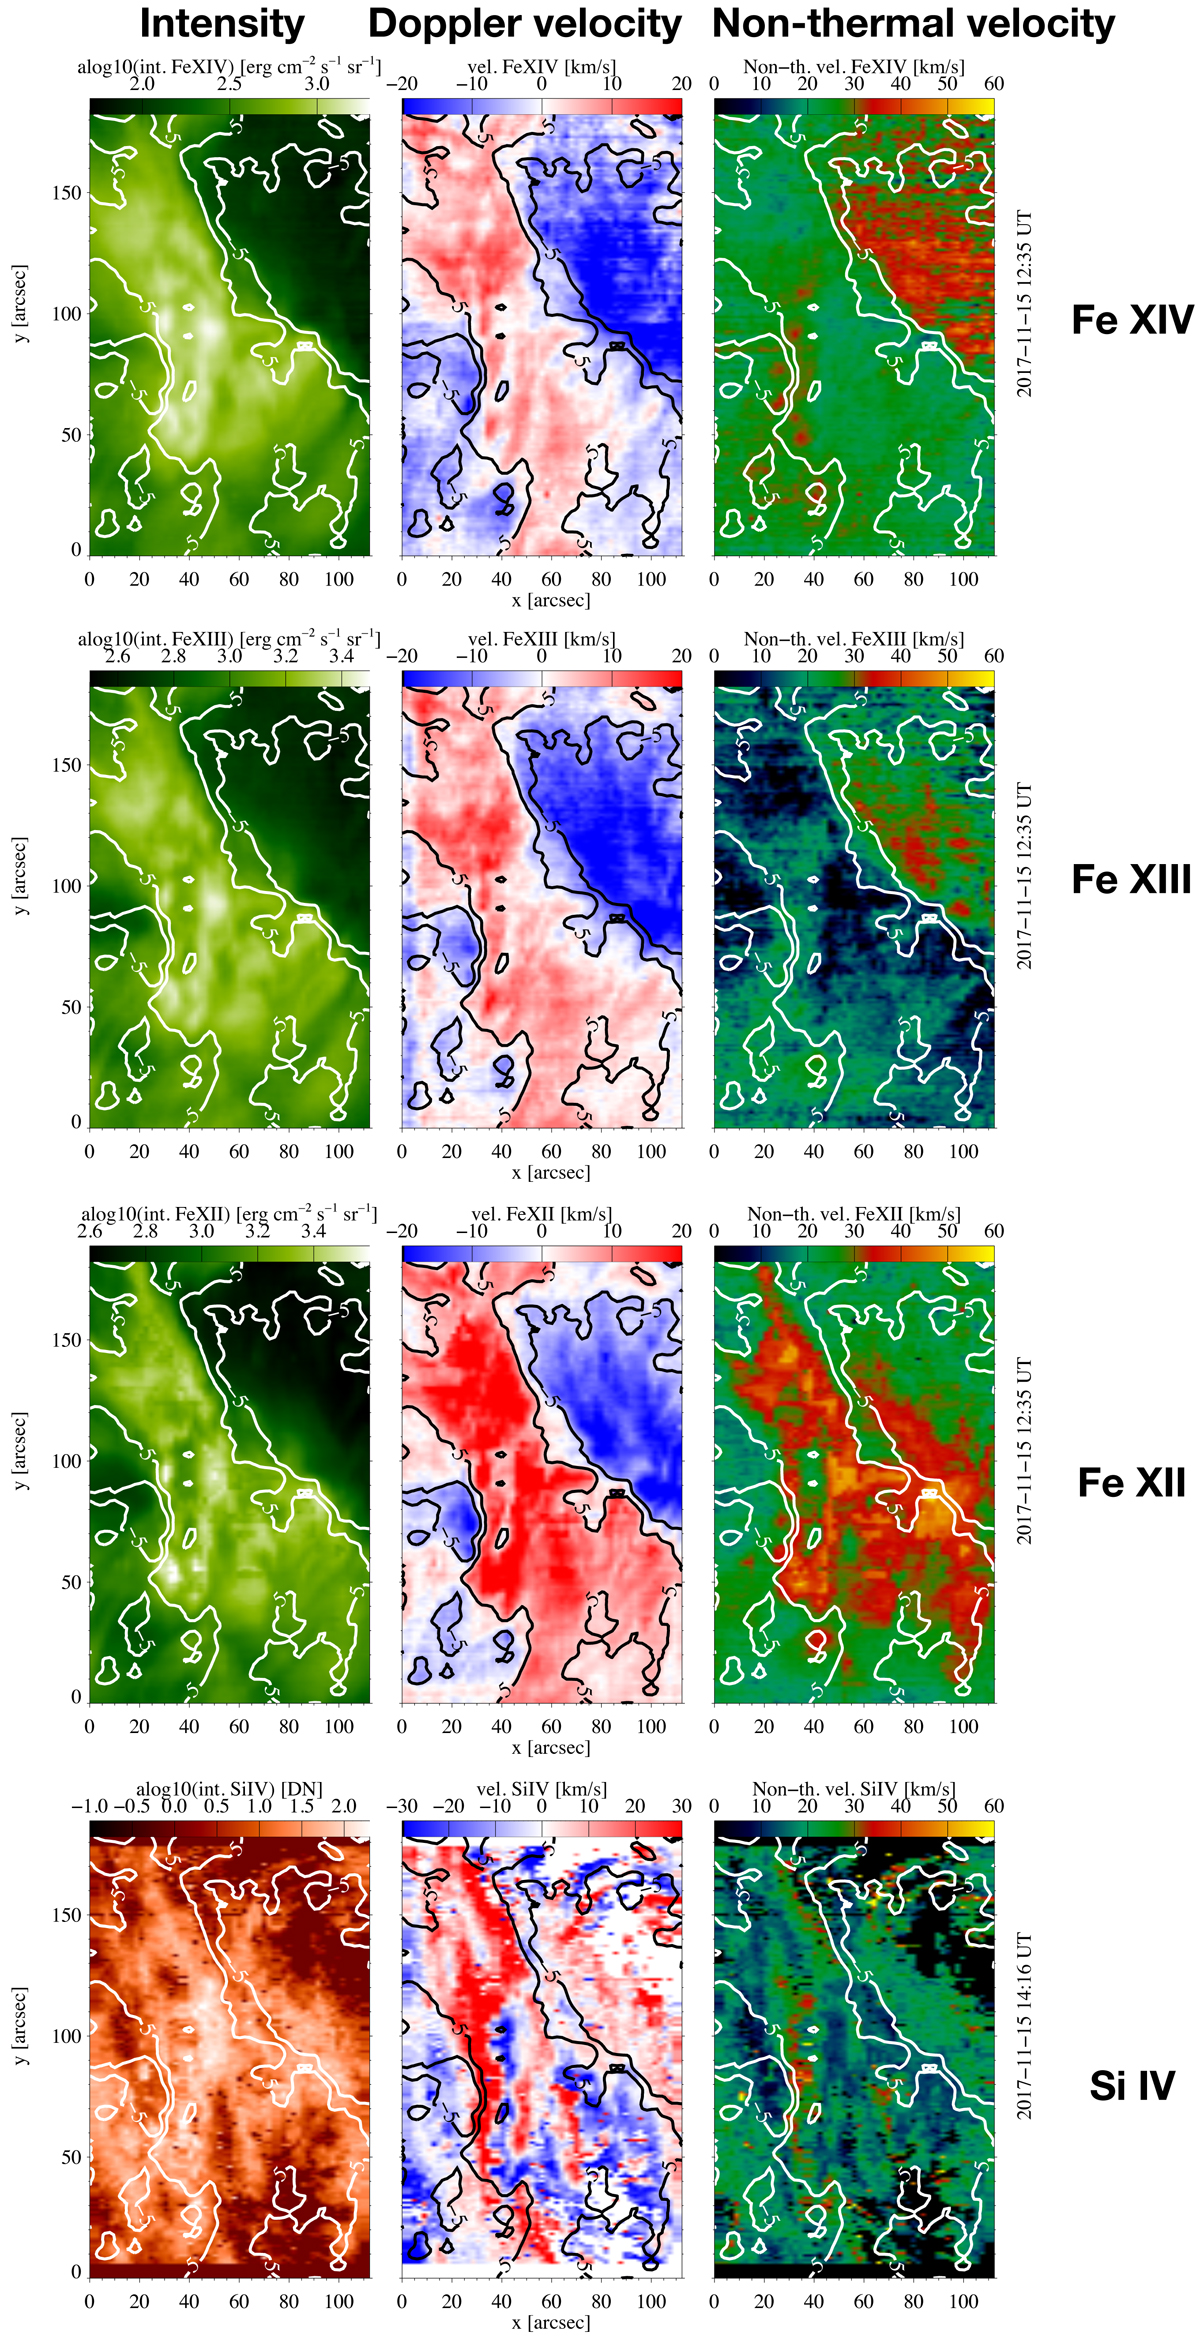
Corona and transition region of the active region core and upflow region observed with Hinode (first three top row) and IRIS (bottom row) on 15 November 2017. The panels show the intensity (left column), Doppler velocity (middle column), and non-thermal velocity (right column). The rows are ordered with decreasing line formation temperatures from 2 MK (Fe XIV line, top row) to 0.08 MK (Si IV, bottom row). To distinguish the active region core and upflow region, we added the contour line of the velocity in Fe XII line of 5 km s−1 and −5 km s−1, respectively.
Current usage metrics show cumulative count of Article Views (full-text article views including HTML views, PDF and ePub downloads, according to the available data) and Abstracts Views on Vision4Press platform.
Data correspond to usage on the plateform after 2015. The current usage metrics is available 48-96 hours after online publication and is updated daily on week days.
Initial download of the metrics may take a while.