Fig. 1.
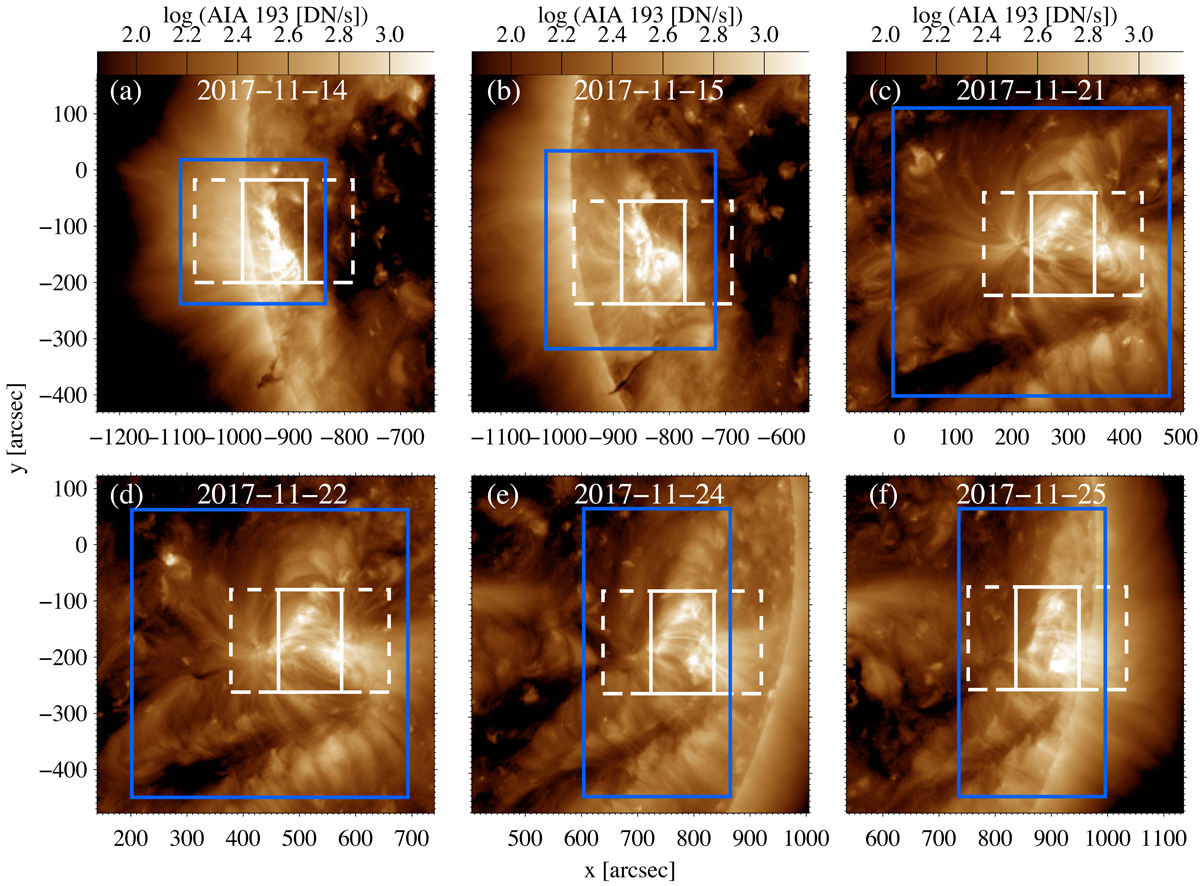
Active region context and regions of interest with upflow and the active region core. All panels show the emission of around 1.5 MK observed in AIA193 Å channel from 14 November 2017 to 25 November 2017. The blue box indicates the Hinode/EIS full FOV. The white dashed and solid boxes highlight the IRIS slit jaw and raster FOV, respectively. The solid white box of panel b is zoomed in Figs. 2 and 3.
Current usage metrics show cumulative count of Article Views (full-text article views including HTML views, PDF and ePub downloads, according to the available data) and Abstracts Views on Vision4Press platform.
Data correspond to usage on the plateform after 2015. The current usage metrics is available 48-96 hours after online publication and is updated daily on week days.
Initial download of the metrics may take a while.