Fig. 6.
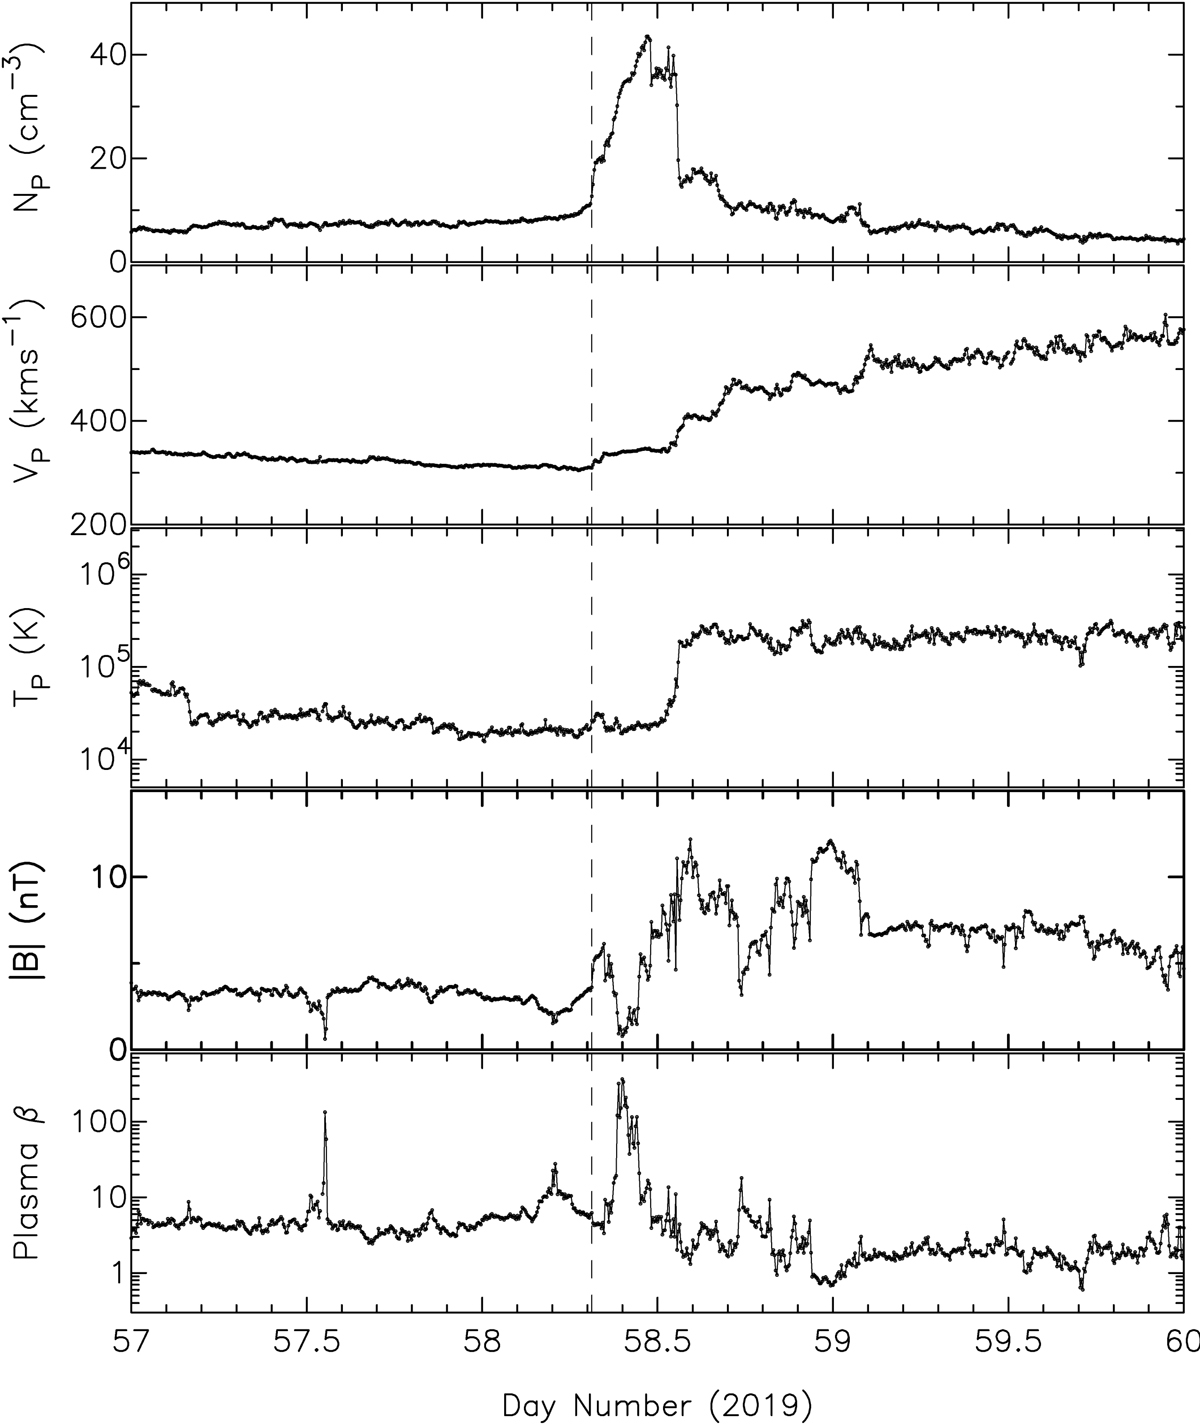
In situ measured 5-min averaged OMNI data for a 3-day period, from 26 to 28 February 2019, during the passage of interaction region associated with the high-speed solar wind streams and slow CME or ambient wind. From the top to bottom: following data are plotted: solar wind proton density (Np), velocity (Vp), temperature (Tp), magnitude of the interplanetary magnetic field (|B|) and plasma beta (β). The vertical dashed line indicates the arrival of the interplanetary shock associated with the interaction region. The time immediately after the shock shows the intense interaction region, which is followed by the clear signatures of the high-speed streams from the coronal hole. The data used in this plot are obtained from the OMNI database at https://omniweb.gsfc.nasa.gov.
Current usage metrics show cumulative count of Article Views (full-text article views including HTML views, PDF and ePub downloads, according to the available data) and Abstracts Views on Vision4Press platform.
Data correspond to usage on the plateform after 2015. The current usage metrics is available 48-96 hours after online publication and is updated daily on week days.
Initial download of the metrics may take a while.