Fig. 3.
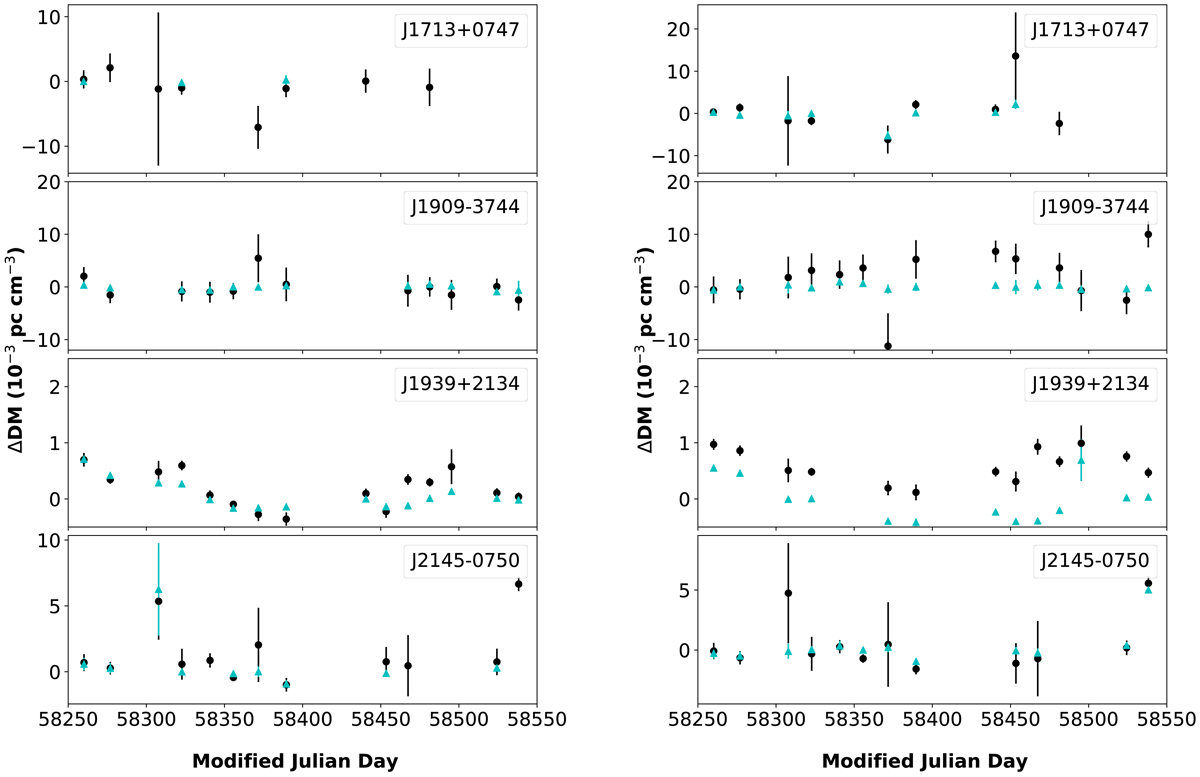
DM time series after subtracting the median DM obtained from the BAND3 and BAND5 combined data as shown in Table 2 of the pulsars presented in this work. Left panel: DM time series obtained by METHOD1. Right panel: DM time series obtained by METHOD2. Black filled circles represent DM obtained from BAND3 and Cyan triangles indicate DM obtained by combining bands 3 and 5. The median DM obtained from combining the two bands (refer to Table 2) are subtracted from the DM values to produce this plot. The DMs obtained with only using BAND5 data are not shown in the plot as their uncertainties are large.
Current usage metrics show cumulative count of Article Views (full-text article views including HTML views, PDF and ePub downloads, according to the available data) and Abstracts Views on Vision4Press platform.
Data correspond to usage on the plateform after 2015. The current usage metrics is available 48-96 hours after online publication and is updated daily on week days.
Initial download of the metrics may take a while.