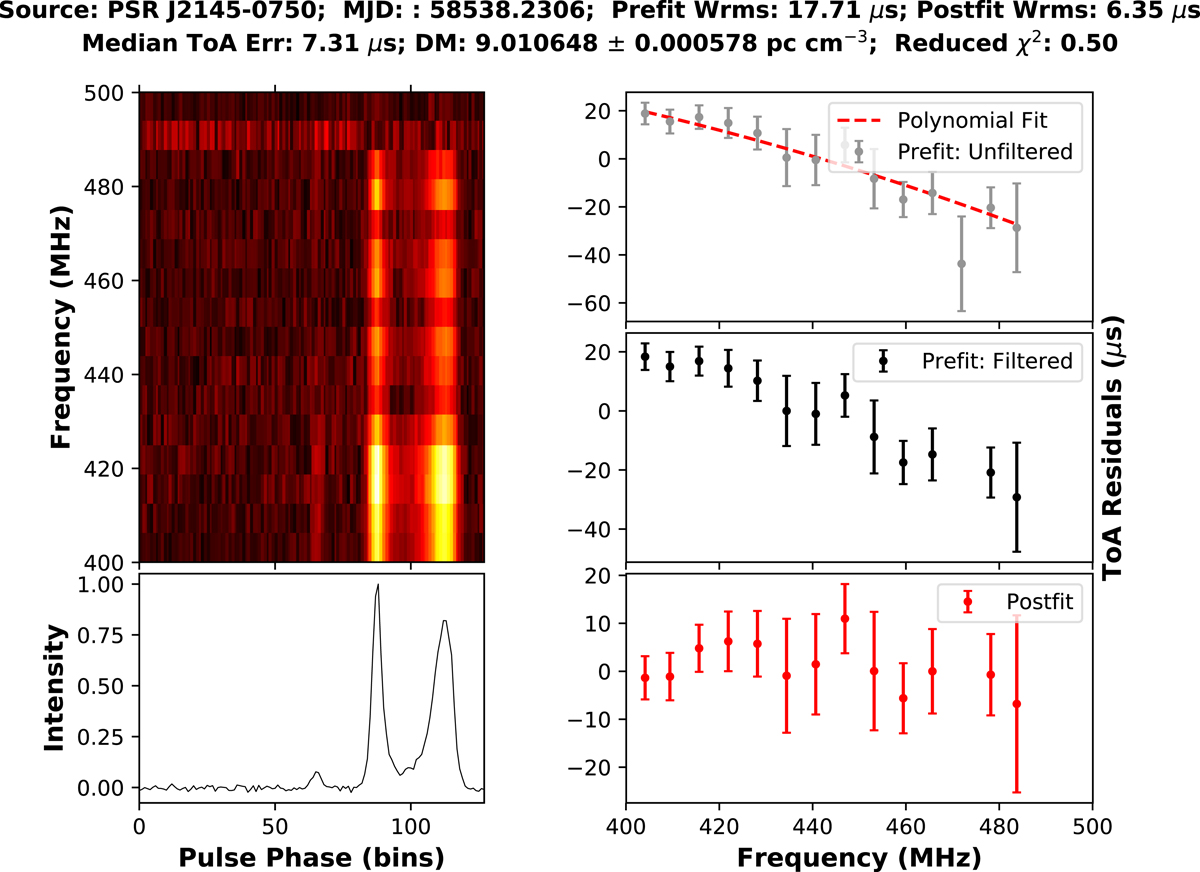
Fig. 2.

Sample analysis plot of DMcalc using the observation of PSR J2145−0750 at BAND3 on 24 February 2019, when an excess DM was seen towards this pulsar (see Sect. 4 for the discussion). Details of the fit can be found at the top of the plot. Right panel: the top plot shows the pre-fit residuals obtained from TEMPO2 as grey circles and the Huber Regression fit to it as a dashed line in red. Middle panel: pre-fit ToAs after removing the outliers. Bottom panel: ToAs after fitting for DM using TEMPO2. The details of the analysis method can be found in Sect. 3.2. Left panel: the top panel shows an image of the frequency spectra of the pulse profiles of a 25 min observation after applying the DM correction and the bottom shows the frequency and time averaged profile of the observation. Source: PSR J2145−0750; MJD: 58538.2306; Prefit Wrms: 17.71 μs; Postfit Wrms: 6.35 μs; Median ToA Err: 7.31 μs; DM: 9.010648 ± 0.000578 pc cm−3; Reduced χ2: 0.50.
Current usage metrics show cumulative count of Article Views (full-text article views including HTML views, PDF and ePub downloads, according to the available data) and Abstracts Views on Vision4Press platform.
Data correspond to usage on the plateform after 2015. The current usage metrics is available 48-96 hours after online publication and is updated daily on week days.
Initial download of the metrics may take a while.


