Fig. 1.
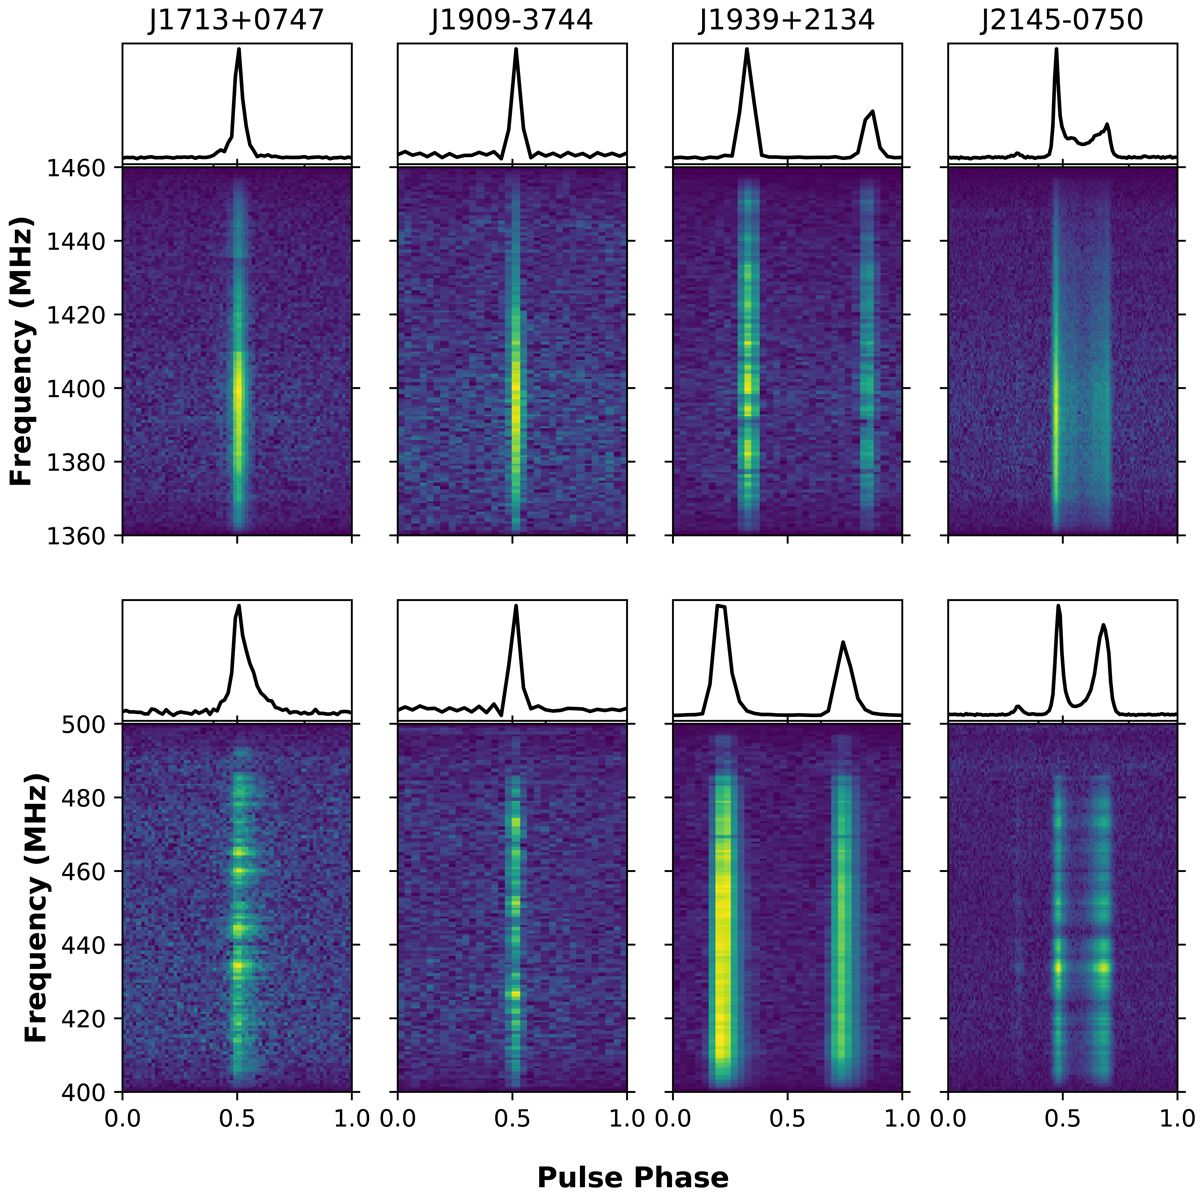
Collage of the frequency evolution seen in the pulse profiles of the four pulsars presented in this work, along with their frequency averaged profiles. Top panel: data from BAND5 and bottom panel: BAND3 data. The data for the plot were obtained after adding high S/N observations from several epochs together using the known ephemeris of each pulsar.
Current usage metrics show cumulative count of Article Views (full-text article views including HTML views, PDF and ePub downloads, according to the available data) and Abstracts Views on Vision4Press platform.
Data correspond to usage on the plateform after 2015. The current usage metrics is available 48-96 hours after online publication and is updated daily on week days.
Initial download of the metrics may take a while.