Fig. E.1.
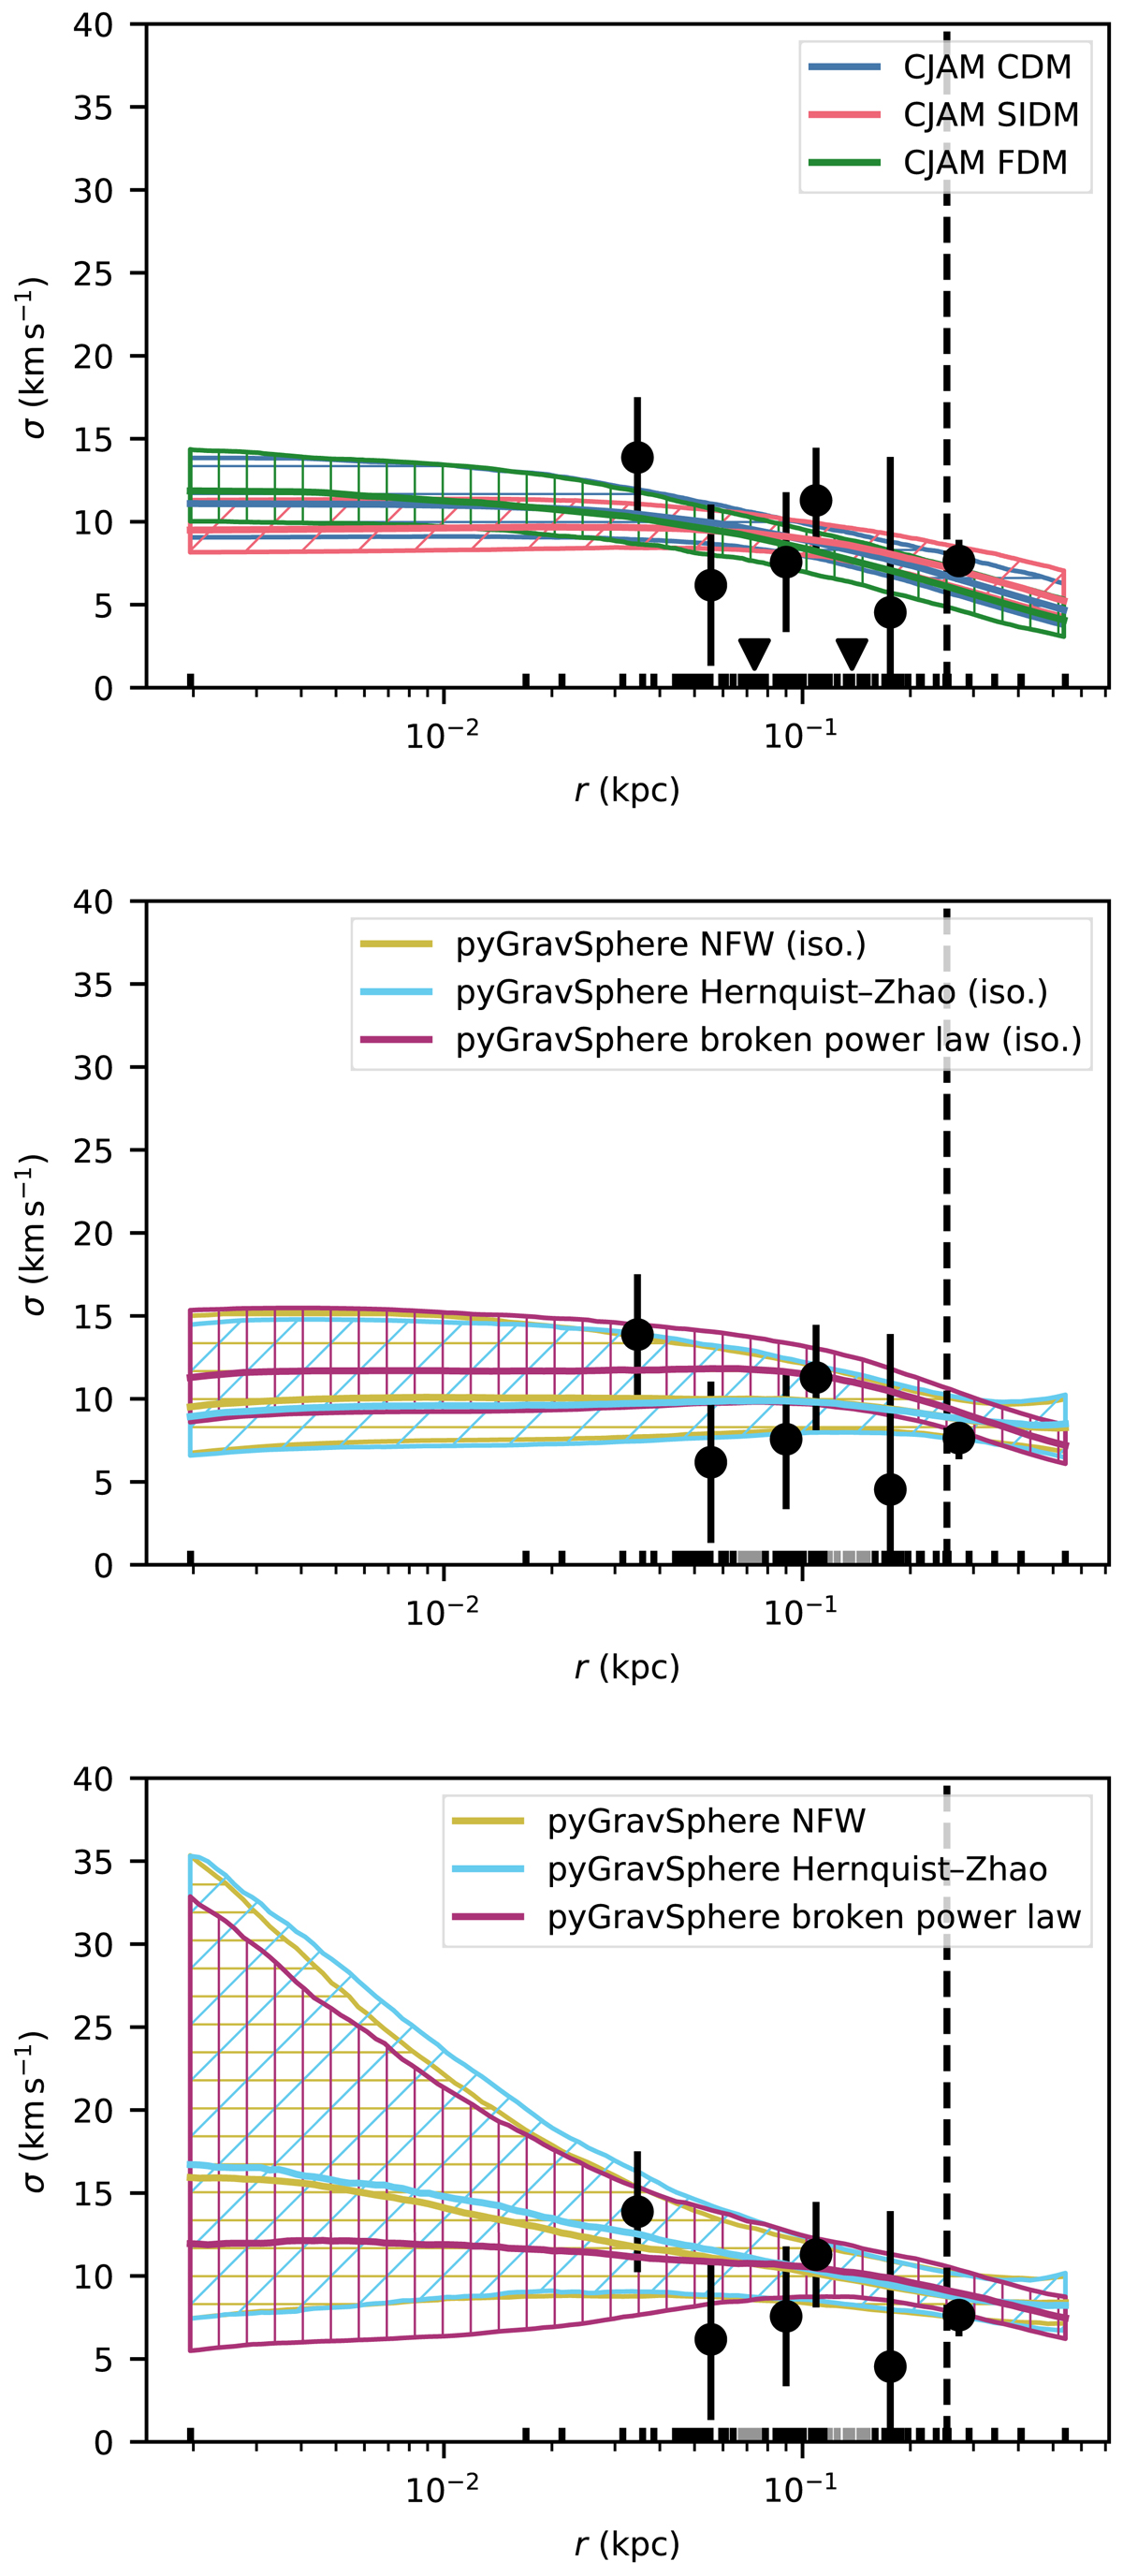
Recovered intrinsic velocity dispersion profiles of Eridanus 2. Top: CJAM models for CDM, SIDM, and FDM. Centre: pyGravSphere models assuming an isotropic velocity distribution, with NFW, Hernquist–Zhao, and broken power-law profiles. Bottom: as above, without assuming isotropy. Binned intrinsic velocity dispersion estimates are indicated with black circles and error bars, or with downward triangles where negative. The hatched bands represent the 68% confidence interval on the density at each radius. The half-light radius is indicated with the vertical dashed line. The black markers at the bottom of the figure show the projected radii of the kinematic tracers. Tracers in bins rejected by pyGravSphere are marked in grey.
Current usage metrics show cumulative count of Article Views (full-text article views including HTML views, PDF and ePub downloads, according to the available data) and Abstracts Views on Vision4Press platform.
Data correspond to usage on the plateform after 2015. The current usage metrics is available 48-96 hours after online publication and is updated daily on week days.
Initial download of the metrics may take a while.