Free Access
Fig. 8.
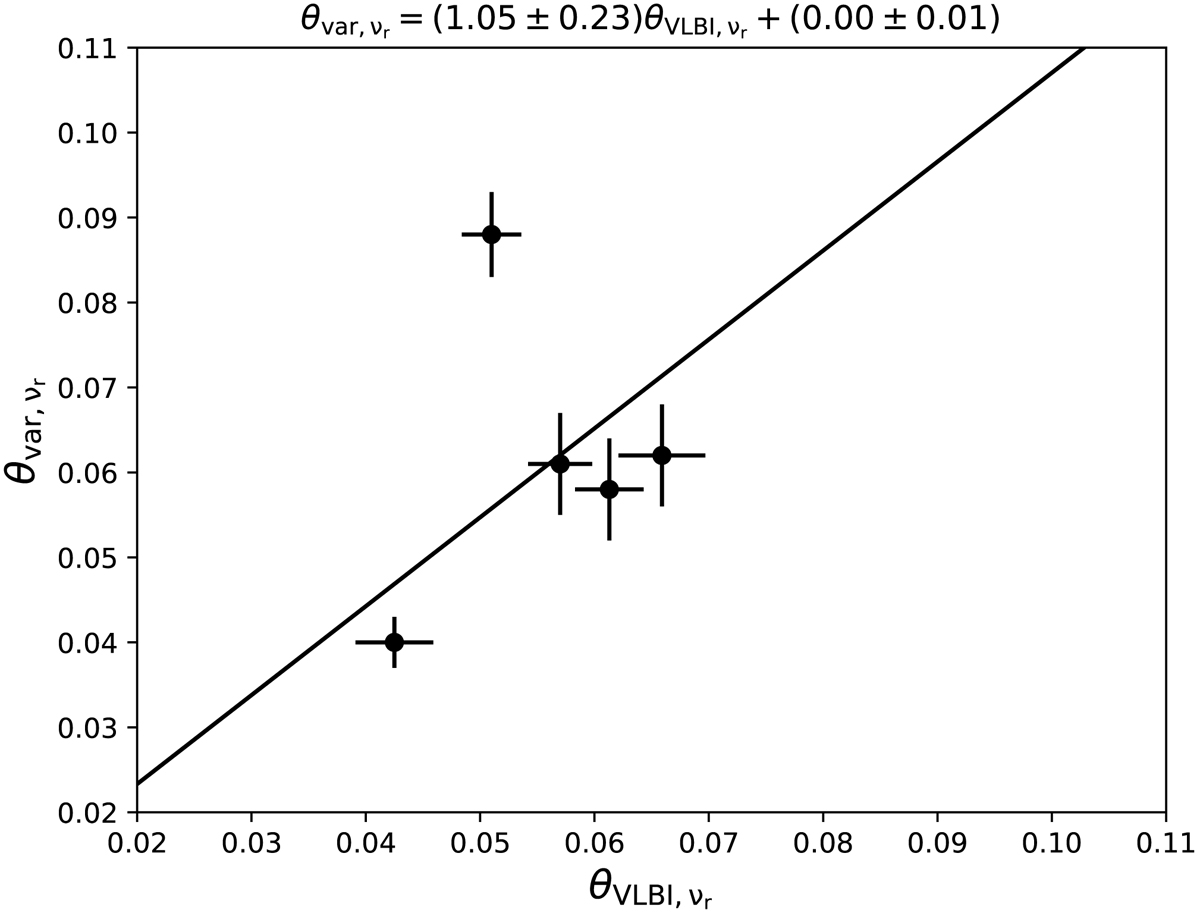
Comparison between extrapolated sizes θvar, νr and θVLBI, νr at turnover frequency from θvar, 15 and θVLBI, 43 based on the jet geometry ϵ = 0.44 (Algaba et al. 2017). The solid line represents the result of the linear fitting (as also described at the top of the figure).
Current usage metrics show cumulative count of Article Views (full-text article views including HTML views, PDF and ePub downloads, according to the available data) and Abstracts Views on Vision4Press platform.
Data correspond to usage on the plateform after 2015. The current usage metrics is available 48-96 hours after online publication and is updated daily on week days.
Initial download of the metrics may take a while.