Free Access
Fig. 7.
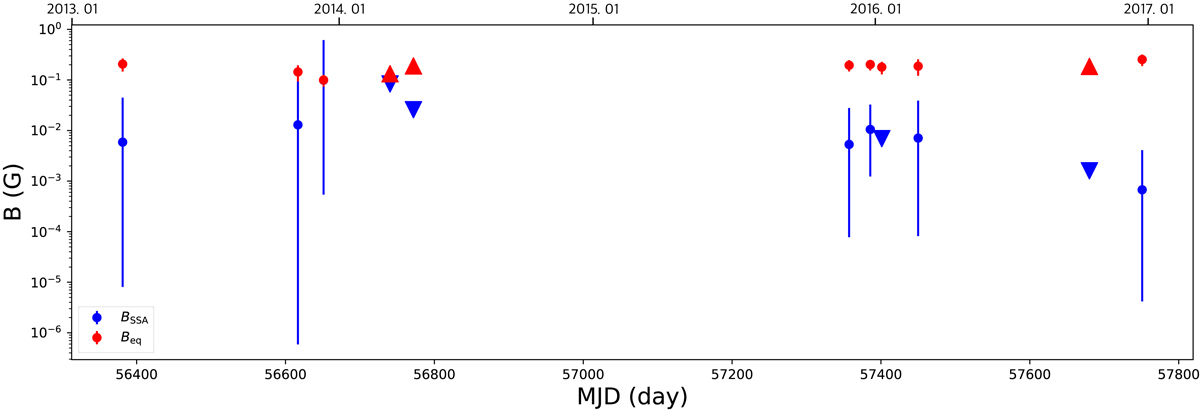
Estimated magnetic field strengths of the SSA region and the energy equipartition region. Filled red circles represent Beq, while filled blue circles represent BSSA. Triangles are lower limits, and inverted triangles are upper limits. The lower uncertainty of BSSA is computed in logarithm (see Appendix C).
Current usage metrics show cumulative count of Article Views (full-text article views including HTML views, PDF and ePub downloads, according to the available data) and Abstracts Views on Vision4Press platform.
Data correspond to usage on the plateform after 2015. The current usage metrics is available 48-96 hours after online publication and is updated daily on week days.
Initial download of the metrics may take a while.