Fig. 4.
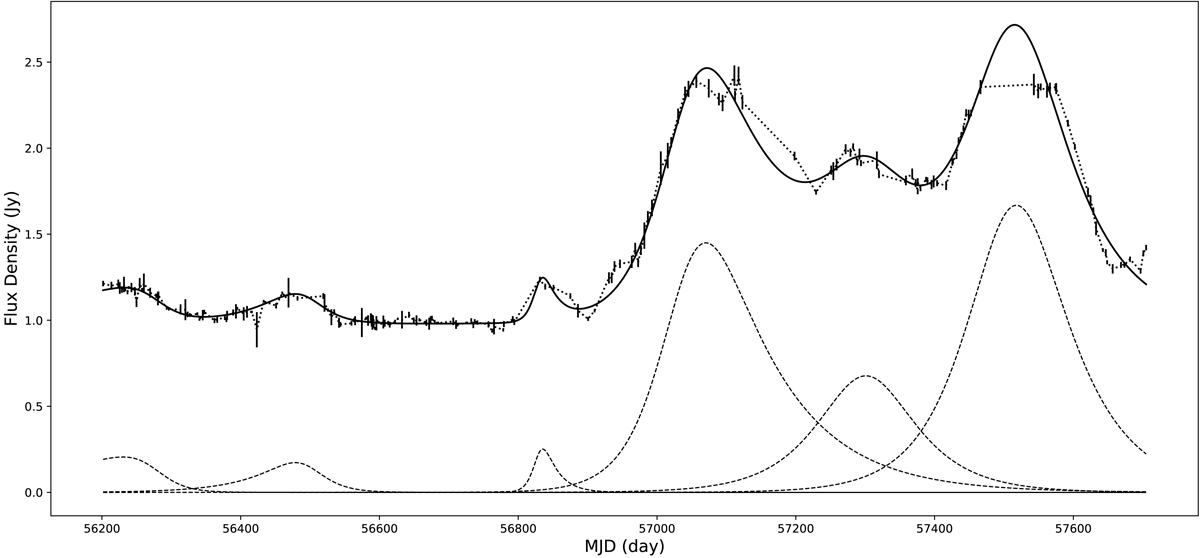
Decomposition of the OVRO light curve with six flares. As we could not constrain the peak for the first flare, we did not use the first flare to estimate the variability brightness temperature, ![]() , or the variability Doppler factor, δvar. The dotted line is to connect the measurements, the dashed lines are the best fitting models of individual flares, and the solid line is the sum of the individual models.
, or the variability Doppler factor, δvar. The dotted line is to connect the measurements, the dashed lines are the best fitting models of individual flares, and the solid line is the sum of the individual models.
Current usage metrics show cumulative count of Article Views (full-text article views including HTML views, PDF and ePub downloads, according to the available data) and Abstracts Views on Vision4Press platform.
Data correspond to usage on the plateform after 2015. The current usage metrics is available 48-96 hours after online publication and is updated daily on week days.
Initial download of the metrics may take a while.