Fig. 3.
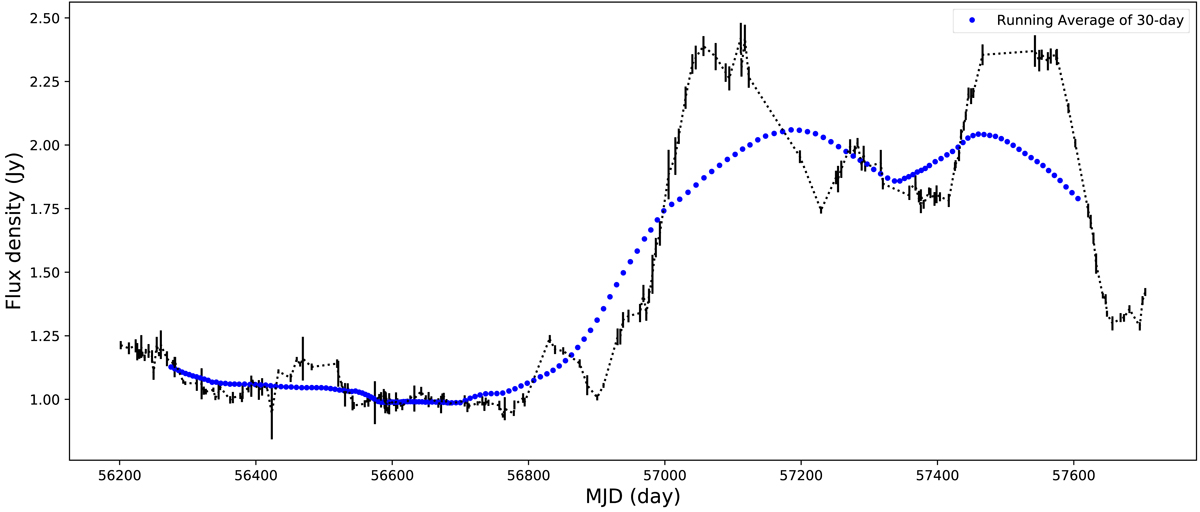
30-day running average of the OVRO 15 GHz data (blue). A flare was defined as when the light curve was above the running average. The times at which the flux density was above the average and the peak flux density within this time were used as initial conditions for the fitting algorithm described in Sect. 3.2. The dotted lines are to connect the measurements.
Current usage metrics show cumulative count of Article Views (full-text article views including HTML views, PDF and ePub downloads, according to the available data) and Abstracts Views on Vision4Press platform.
Data correspond to usage on the plateform after 2015. The current usage metrics is available 48-96 hours after online publication and is updated daily on week days.
Initial download of the metrics may take a while.