Fig. 8
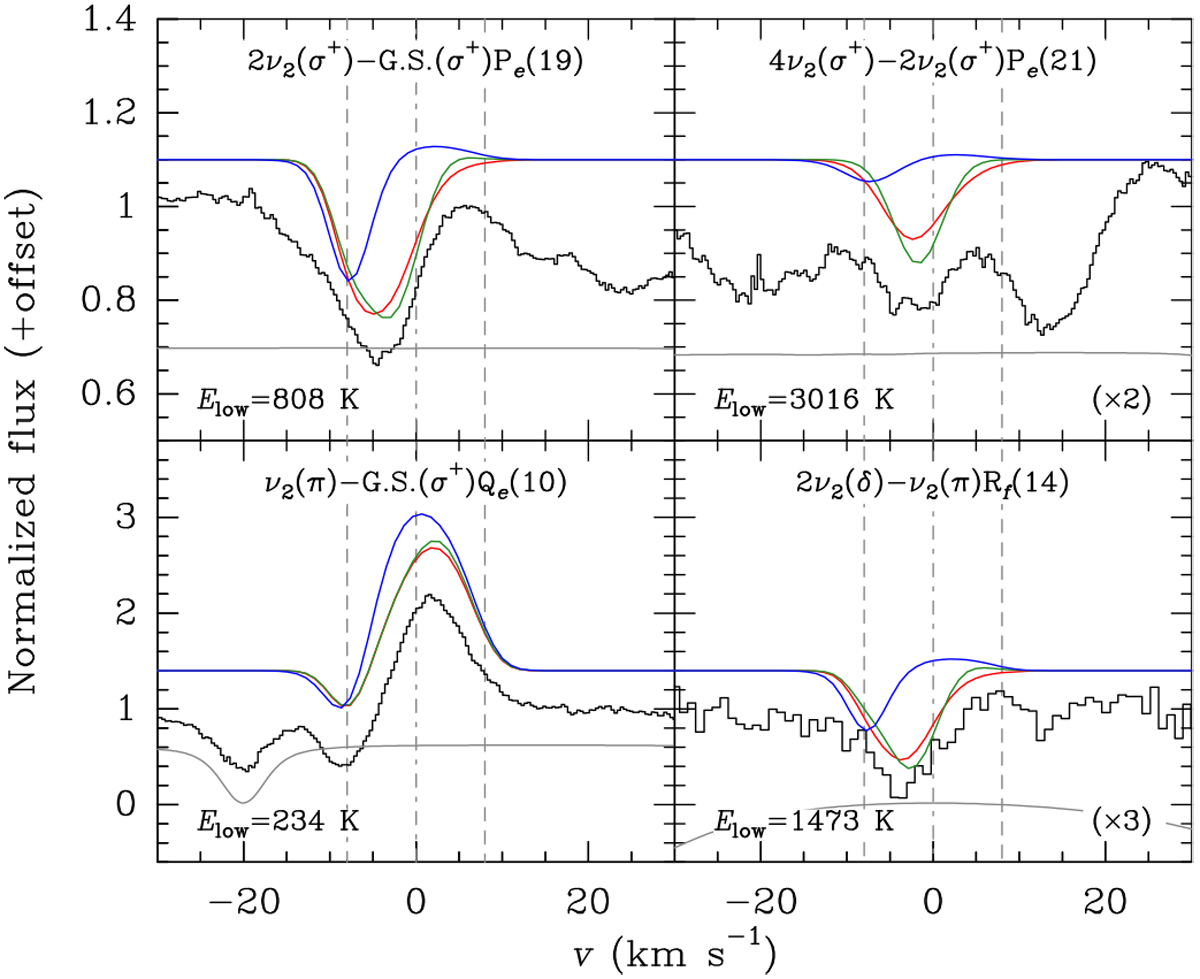
Effect of varying the turbulent velocity and the gas expansion velocity at the stellar surface (green and blue, respectively) on the synthetic profiles coming from different regions of the envelope. The observations are the black histograms and the best fits are plotted in red. In the green curves, the turbulent velocity was set to 5 km s−1. The blue curves were calculated with a constant gas expansion velocity of 8 km s−1 throughout the whole envelope. These curves are vertically shifted for clarity. Elow is the energy of the lower level of the ro-vibrational transitions. The gray solid curves are the atmospheric transmission. The vertical gray dotted-dashed and dashed lines indicate the systemic velocity and the Doppler shifts related to the terminal velocity.
Current usage metrics show cumulative count of Article Views (full-text article views including HTML views, PDF and ePub downloads, according to the available data) and Abstracts Views on Vision4Press platform.
Data correspond to usage on the plateform after 2015. The current usage metrics is available 48-96 hours after online publication and is updated daily on week days.
Initial download of the metrics may take a while.