Fig. 6
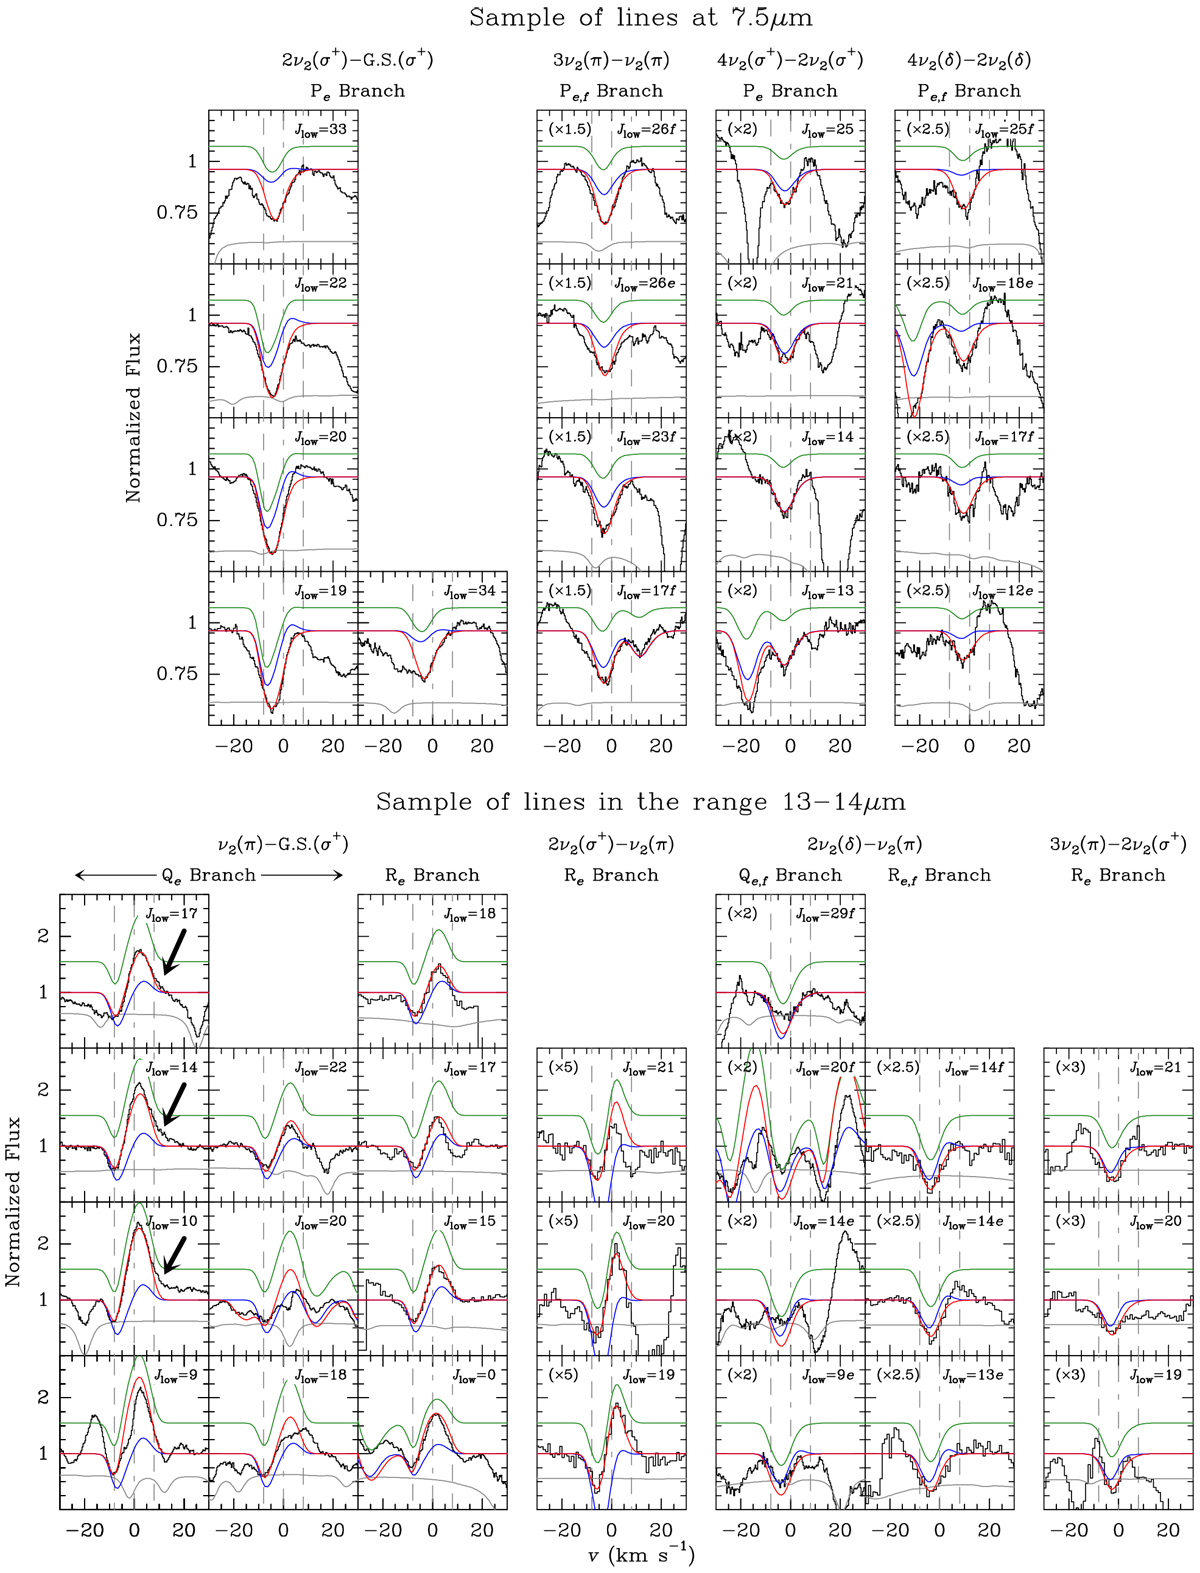
Sample of observed HCN lines in the mid-IR (black histogram) with their best fits (spherically symmetric models; red curves) grouped in bands. The blue solid lines in the range 13–14 μm were calculated with the spherically symmetric envelope model that better fits the lines at 7.5 μm and vice versa (see Table 2 and text). The green solid lines were calculated with the asymmetric envelope model (see Sect. 4.3.2). They are vertically shifted to improve the visibility. The gray curves are the atmospheric transmission. The black arrows point at possible red-shifted wings. The vertical dashed-dotted and dashed lines are the systemic velocity (0 km s−1) and the terminal Doppler velocities derived in this work (≃8 km s−1), respectively. All the fits are reasonably good except those to the lines of band 2ν2 (δ) − ν2(π), Q branch (see text).
Current usage metrics show cumulative count of Article Views (full-text article views including HTML views, PDF and ePub downloads, according to the available data) and Abstracts Views on Vision4Press platform.
Data correspond to usage on the plateform after 2015. The current usage metrics is available 48-96 hours after online publication and is updated daily on week days.
Initial download of the metrics may take a while.