Fig. 5
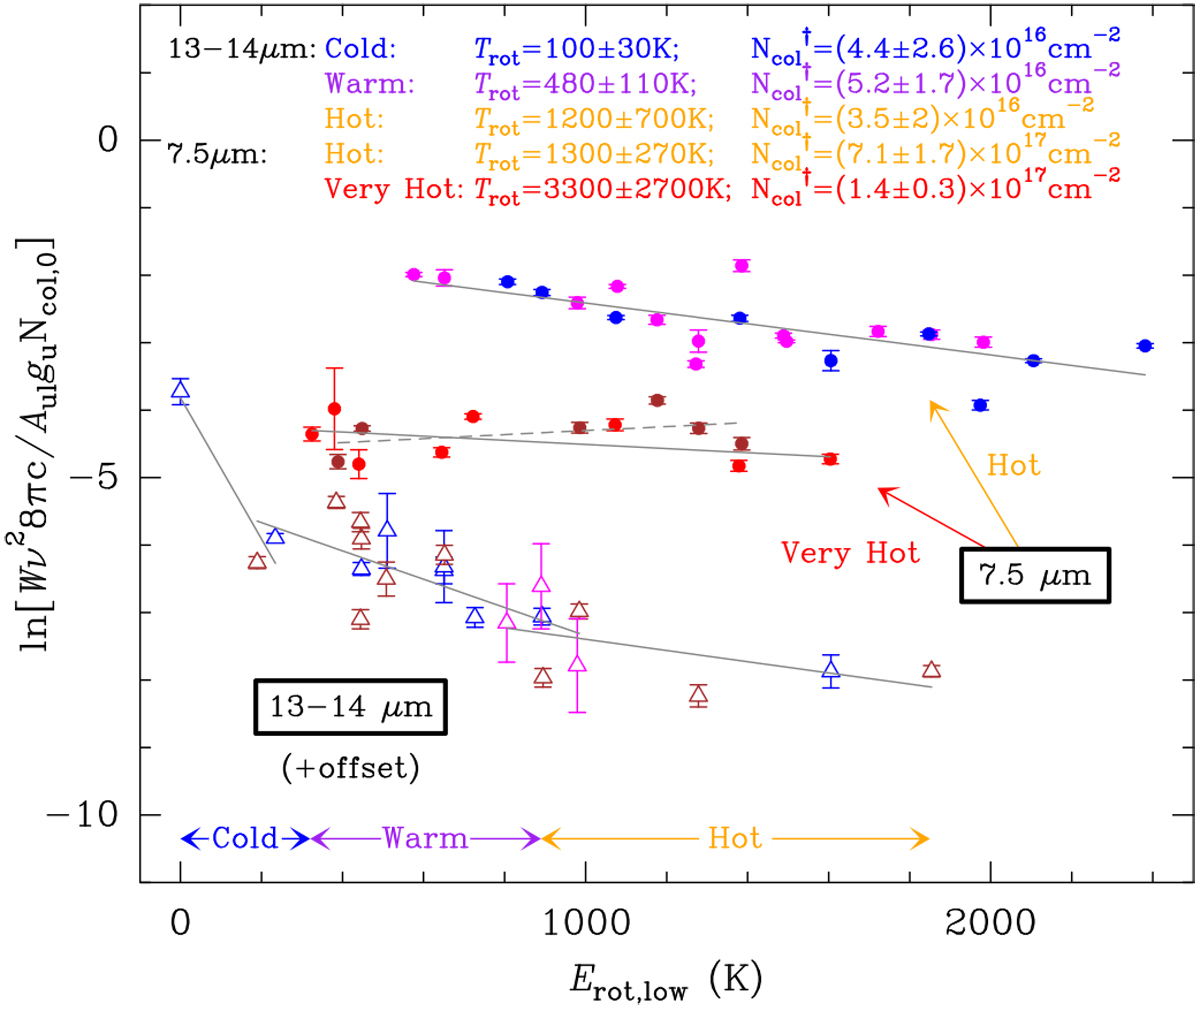
Ro-vibrational diagrams of absorption components of the infrared HCN lines at 7.5 and 13–14 μm. The filled blue, magenta, brown, and red dots correspond to the lines of the bands 2ν2 (σ+), 3ν2 (π) − ν2(π), 4ν2 (σ+) − 2ν2(σ+), and 4ν2 (δ) − 2ν2(δ), respectively (7.5 μm). The empty blue, magenta, and brown empty triangles represent the lines of the bands ν2 (π), 2ν2 (σ+) − ν2(π), and 2ν2 (δ) − ν2(π) at 13–14 μm. The dots related to the hot bands (except 4ν2(σ+) − 2ν2(σ+) and 4ν2 (δ) − 2ν2(δ); see text) are vertically shifted to make them coincide with the fundamental band at 13–14 μm and with thefirst overtone at 7.5 μm to get more populated data sets. An additional offset of − 2 units is added to the data at 13–14 μm to improve visibility. Four populations with various rotational temperatures derived from the fitted solid straight lines can be distinguish (cold, warm, hot, and very hot). The dashed straight line is a fit to the lines of the 4ν2 (σ+) − 2ν2(σ+) band, which implies a negative rotational temperature (see text). ![]() is defined as Ncol,0Zrotey0 (Eq. (2)).
is defined as Ncol,0Zrotey0 (Eq. (2)).
Current usage metrics show cumulative count of Article Views (full-text article views including HTML views, PDF and ePub downloads, according to the available data) and Abstracts Views on Vision4Press platform.
Data correspond to usage on the plateform after 2015. The current usage metrics is available 48-96 hours after online publication and is updated daily on week days.
Initial download of the metrics may take a while.