Fig. 4
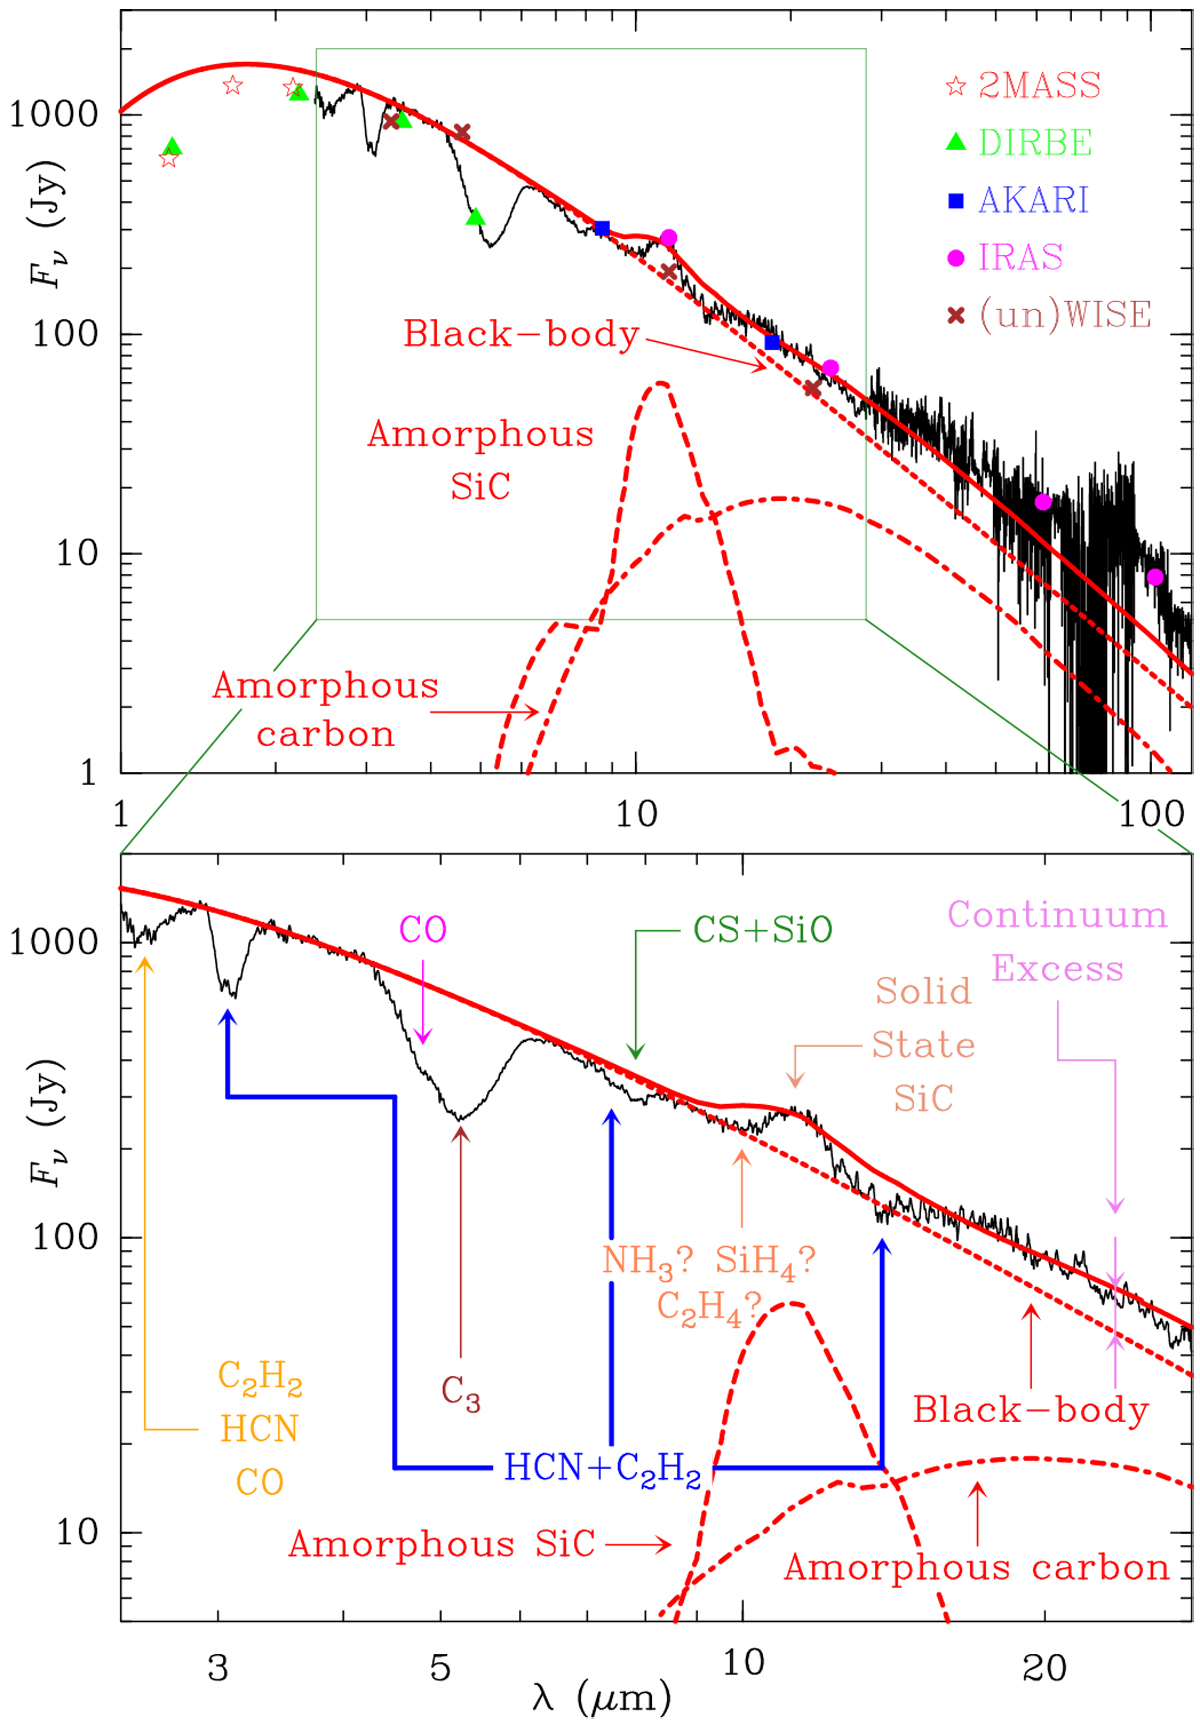
Continuum of Y CVn as observed with ISO (black histogram). The red solid curve is the fit to the observations after the removal of the molecular bands (Table 2). The red dotted curve is the stellar contribution, the red dashed curve the contribution of SiC, and the dotted-dashed one the contribution of amorphous carbon. The red stars, green triangles, blue squares, and magenta circles in the upper panel are photometric measures of the continuum available in different point source catalogs (2MASS, DIRBE, AKARI, IRAS, and WISE – the WISE fluxes at 3.35 and 4.60 μm are clear outliers and they are discarded to use the unWISE values instead). The band identifications in the lower panel are in agreement with previous observations of Y CVn and IRC+10216 (Cernicharo et al. 1999; Yang et al. 2004).
Current usage metrics show cumulative count of Article Views (full-text article views including HTML views, PDF and ePub downloads, according to the available data) and Abstracts Views on Vision4Press platform.
Data correspond to usage on the plateform after 2015. The current usage metrics is available 48-96 hours after online publication and is updated daily on week days.
Initial download of the metrics may take a while.