Fig. 3
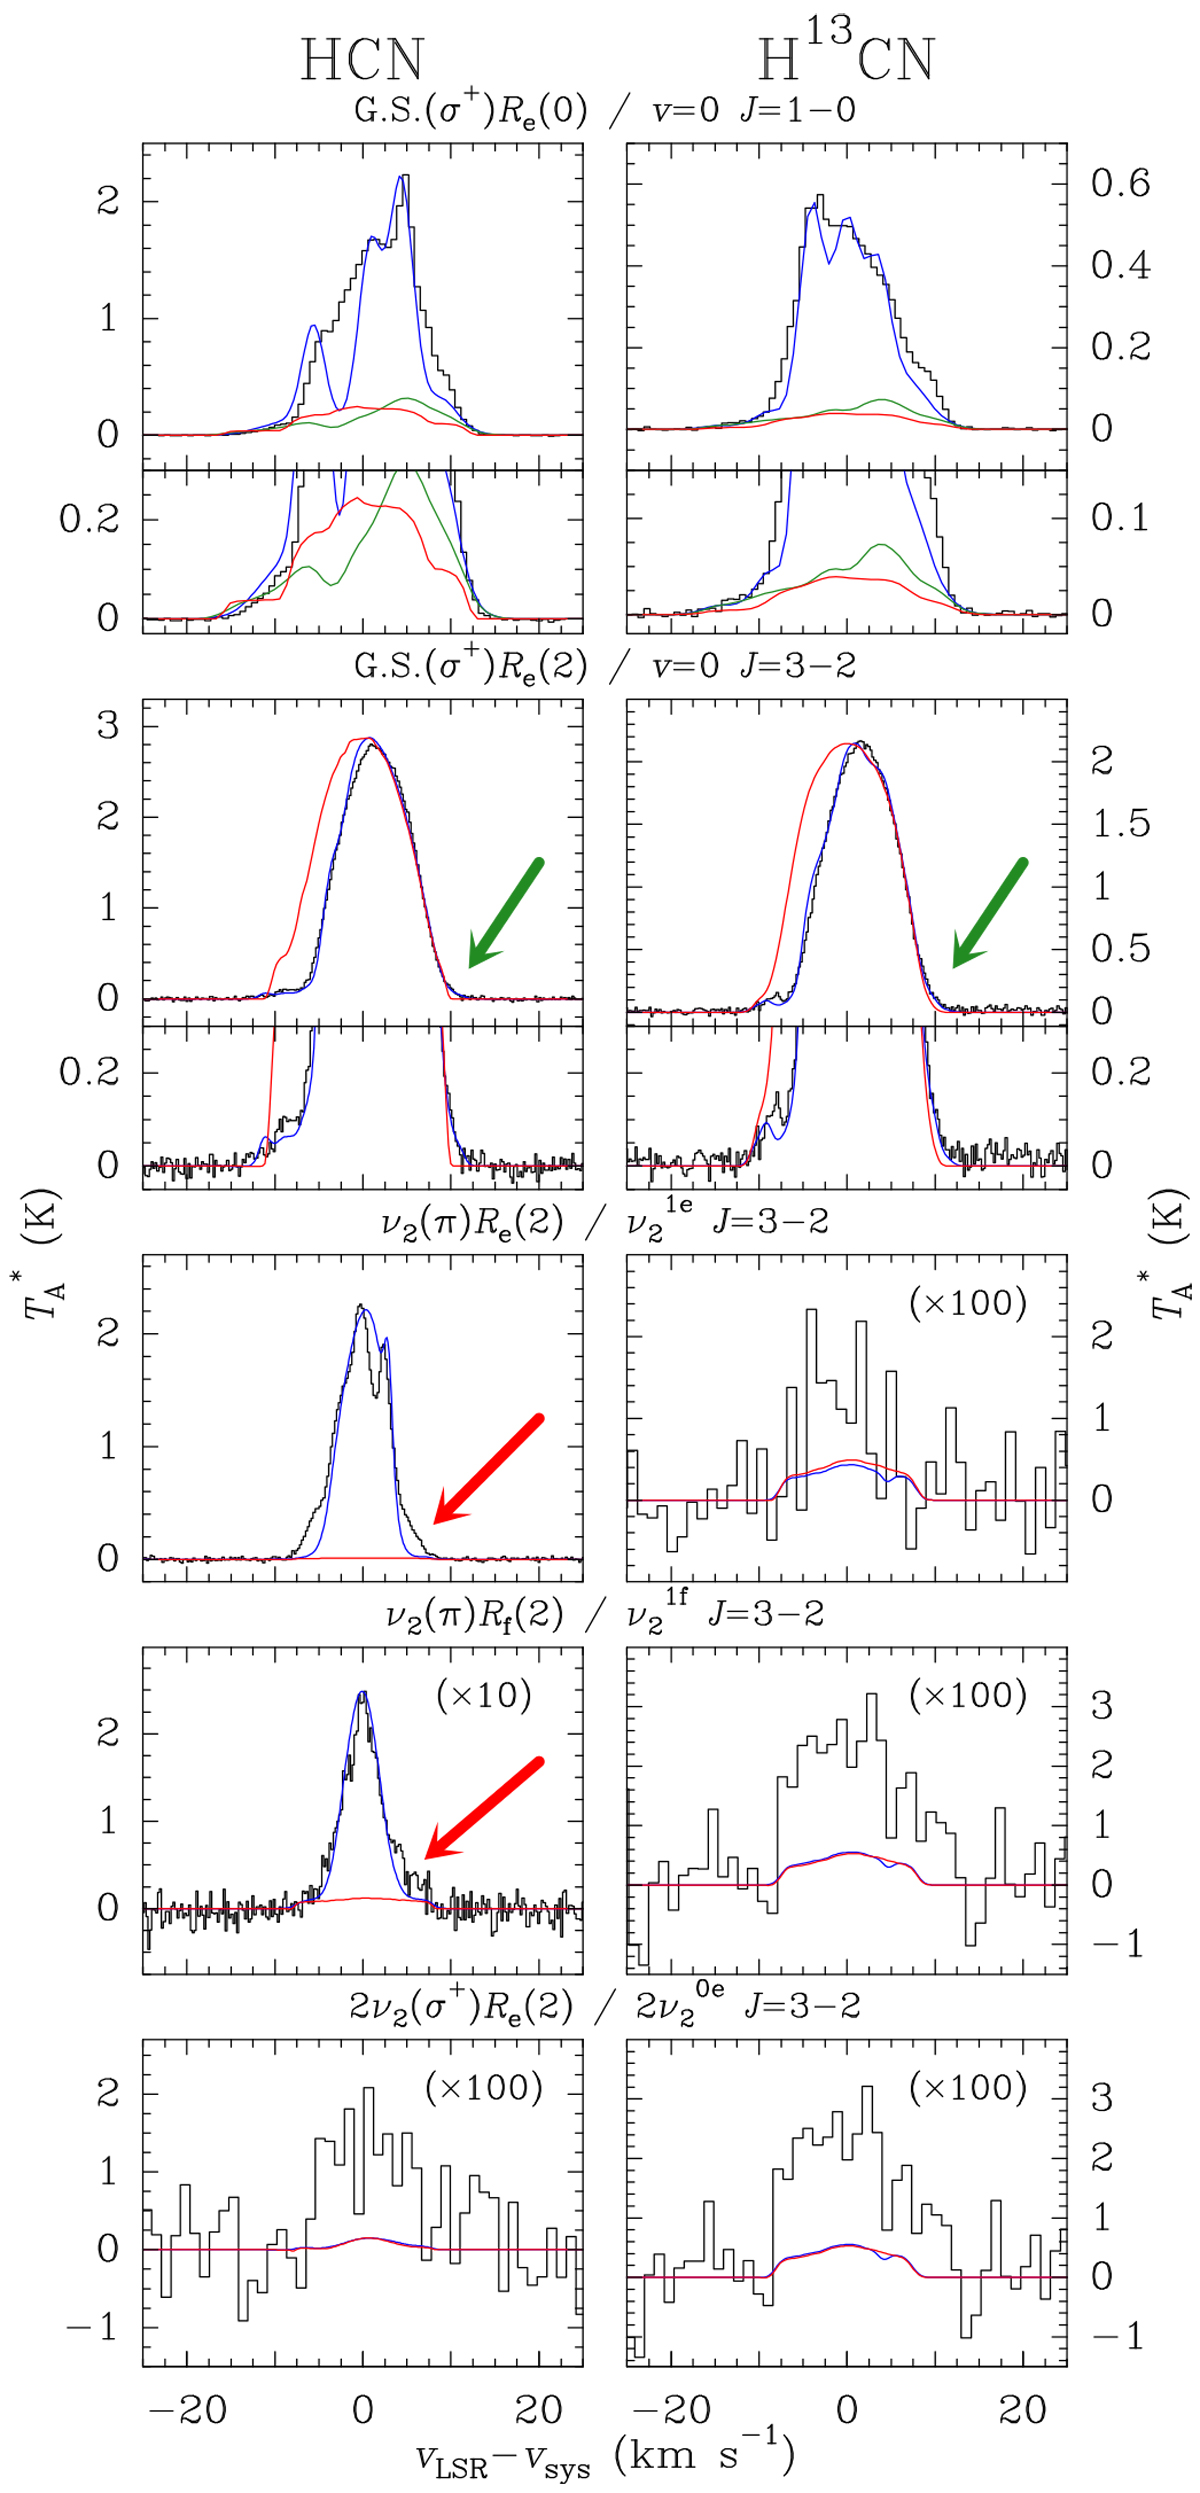
Observed HCN and H13CN lines of Y CVn with the IRAM 30 m telescope (black histograms). The red and blue curves are the synthetic lines derived from the spherically symmetric (red) and asymmetric (including maser emission; blue) envelope models. The red and green arrows point to red-shifted wings that cannot be reproduced with our spherically symmetric envelope model. The small insets in the boxes with the v = 0 J = 1− 0 and 3–2lines zoom in to show the line profiles close to the baseline (Sect. 4.2). The green profiles for these lines were calculated with the asymmetric envelopemodel without considering maser emission (Sect. 5.2.1). The H13 CN lines ![]() and
and ![]() are stronglyoverlapped and the blended line is included twice (lower right panels). The lines of the vibrational states
are stronglyoverlapped and the blended line is included twice (lower right panels). The lines of the vibrational states
![]() and other with higher energies are below the detection limit. In this figure, we use two notations to name the pure rotational lines (see Appendix C.1).
and other with higher energies are below the detection limit. In this figure, we use two notations to name the pure rotational lines (see Appendix C.1).
Current usage metrics show cumulative count of Article Views (full-text article views including HTML views, PDF and ePub downloads, according to the available data) and Abstracts Views on Vision4Press platform.
Data correspond to usage on the plateform after 2015. The current usage metrics is available 48-96 hours after online publication and is updated daily on week days.
Initial download of the metrics may take a while.