Fig. A.1
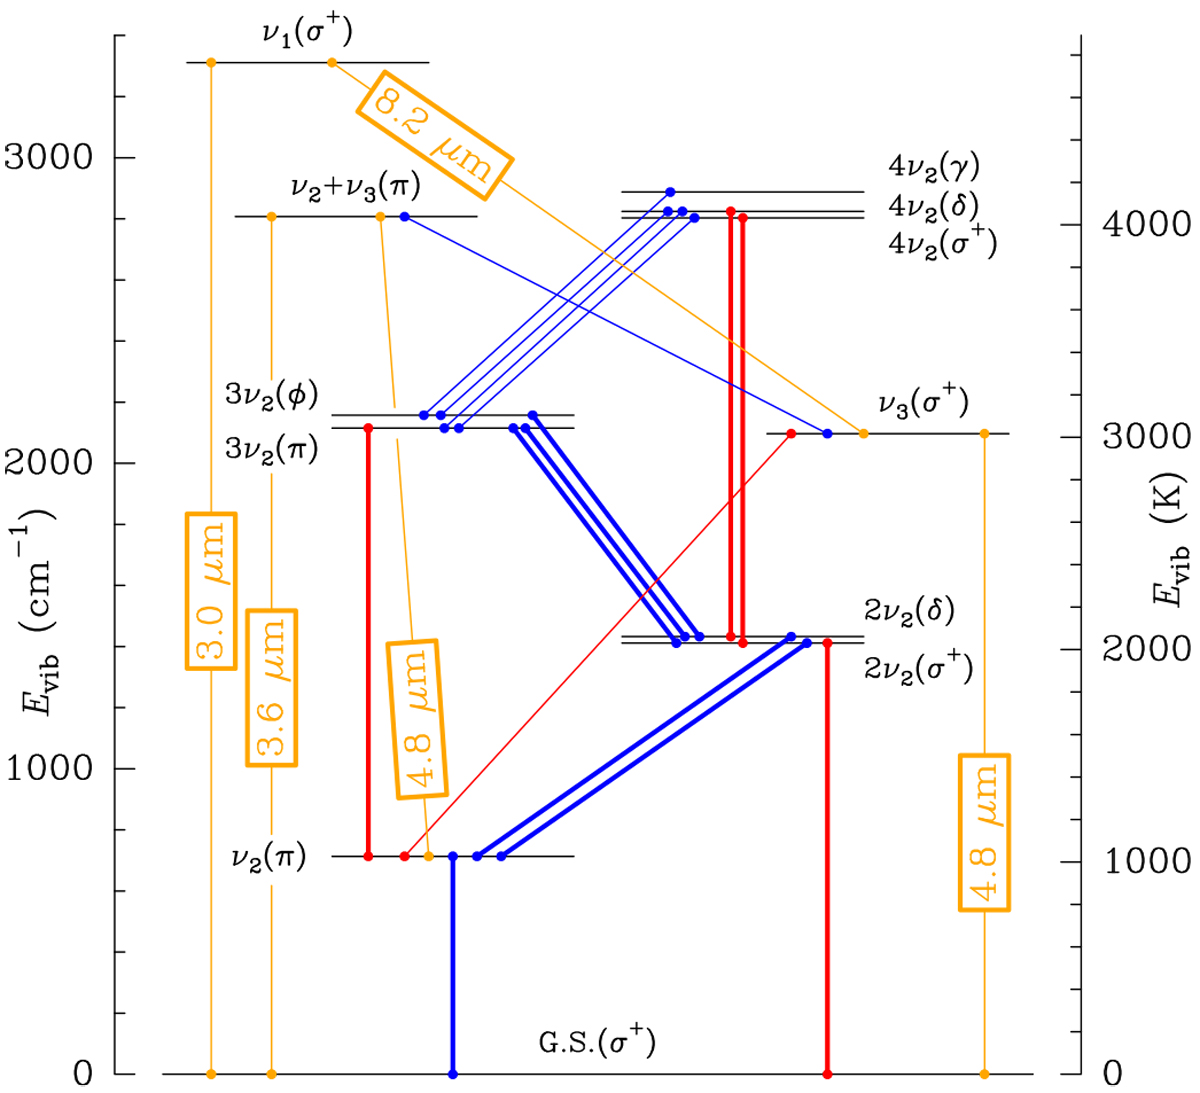
Vibrational energy diagram of HCN below 5000 K. The lines that connect the vibrational states represent the strongest allowed vibrational transitions. The transitions in blue lie around 13.5 μm, in red around 7.5 μm, and in orange at other wavelengths (3.0, 3.6, 4.8, and 8.2 μm, depending on the transition). Those plotted with ticker lines are detected in the spectra presented in the current work (Figs. 1 and 2).
Current usage metrics show cumulative count of Article Views (full-text article views including HTML views, PDF and ePub downloads, according to the available data) and Abstracts Views on Vision4Press platform.
Data correspond to usage on the plateform after 2015. The current usage metrics is available 48-96 hours after online publication and is updated daily on week days.
Initial download of the metrics may take a while.