Fig. 1
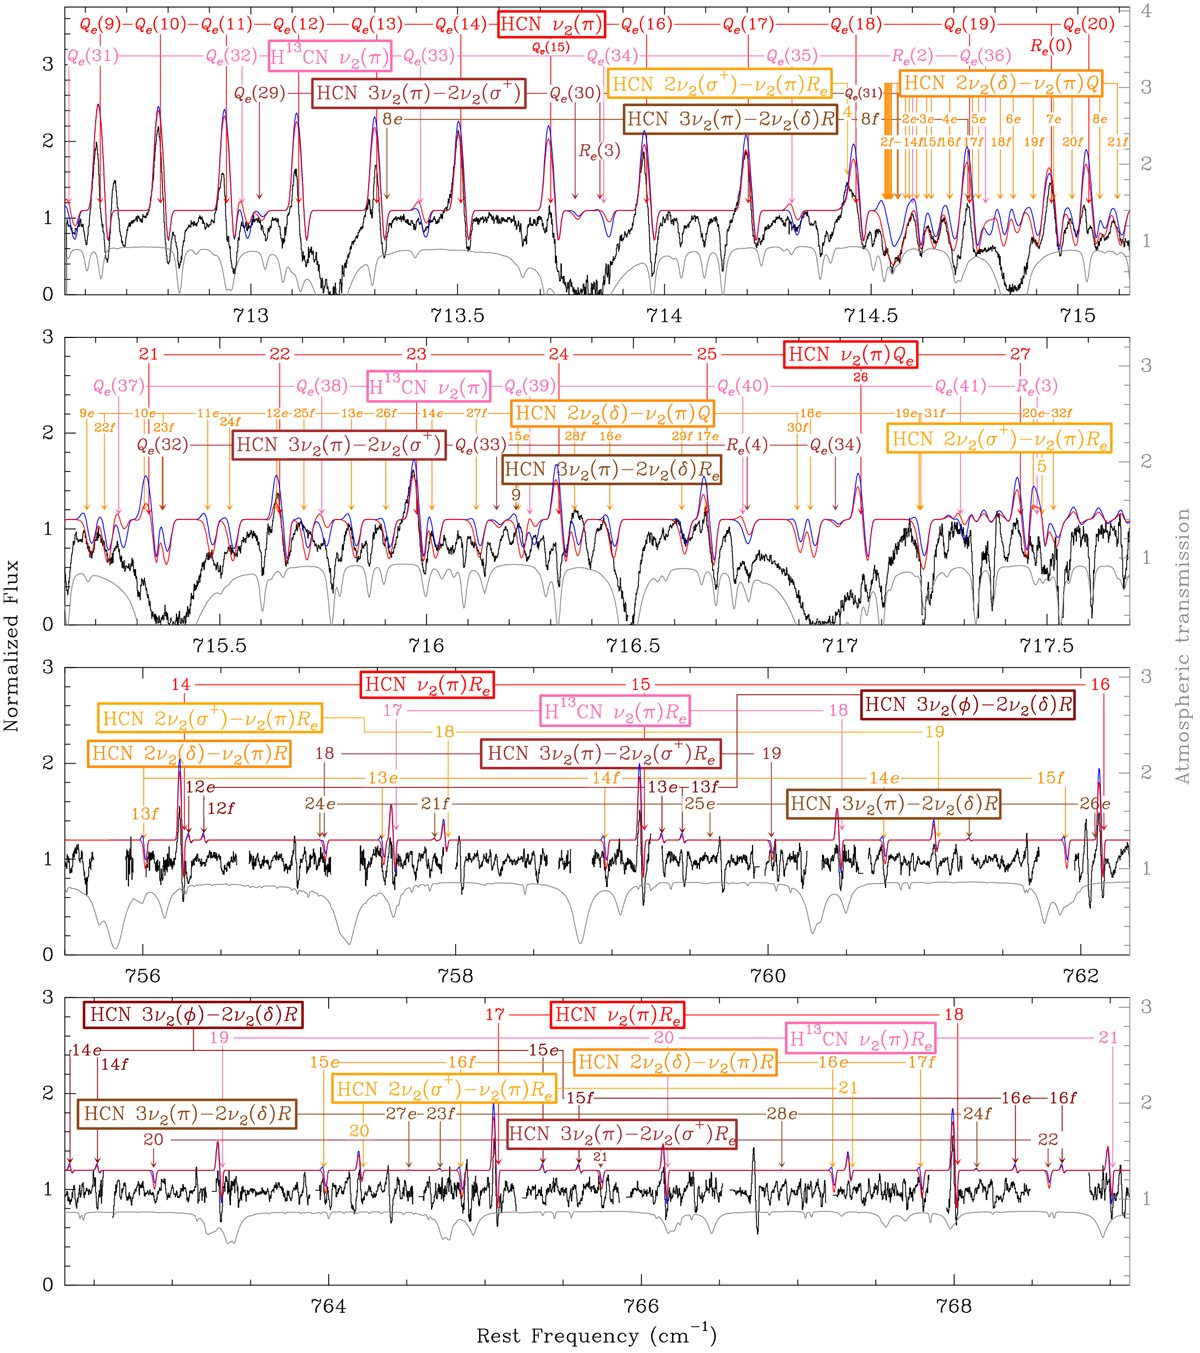
Observed spectrum of Y CVn in the spectral range 13–14 μm (top panels: 14.0 μm, 712.55–717.70 cm−1, SOFIA-EXES; bottom panels: 13.1 μm, 755.50–769.12 cm−1, IRTF-TEXES). The spectra are corrected for the Doppler shift due to the relative movement between the star and the Earth at the time of the observations. The resolving power is R ≃ 67 000 at 14.0 μm and ≃ 83 000 at 13.1 μm, which provides us with a spectral resolution of ≃4.4 and 3.6 km s−1, respectively. Different lines of several vibrational states of HCN (red, orange, and brown) and H13 CN (pink) are found in this spectrum. A model of the atmospheric transmission estimated with the atmospheric transmission calculator ATRAN (Lord 1992) is included in gray. The TEXES data were cleaned from the atmospheric lines with a routine developed by J. H. Lacy. The red and blue curves are the synthetic spectra derived from our spherically symmetric and asymmetric models, respectively.
Current usage metrics show cumulative count of Article Views (full-text article views including HTML views, PDF and ePub downloads, according to the available data) and Abstracts Views on Vision4Press platform.
Data correspond to usage on the plateform after 2015. The current usage metrics is available 48-96 hours after online publication and is updated daily on week days.
Initial download of the metrics may take a while.