Fig. 8
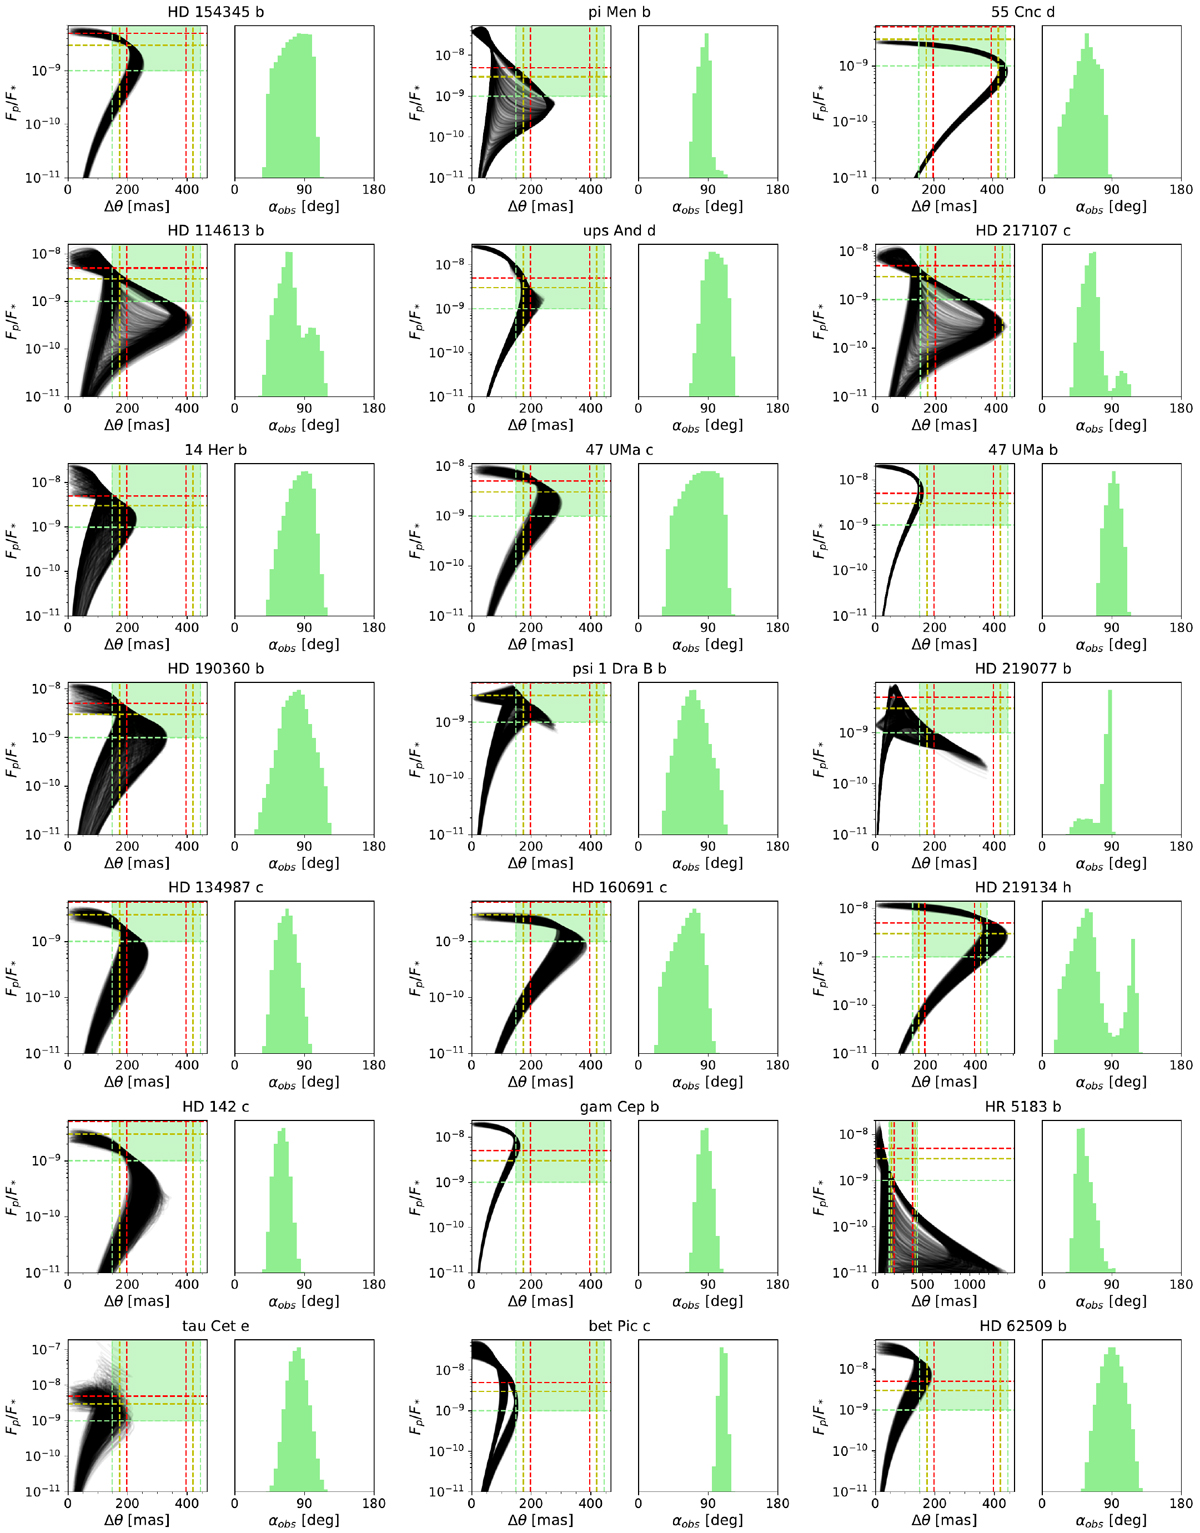
Detectability conditions for the Roman-accessible exoplanets. In each left panel, the solid black lines in the Fp ∕F⋆ -Δθ diagram correspond to independent orbital realizations. For the sake of clarity, only 1000 of the total 10 000 realizations are shown. Horizontal dashed lines indicate Cmin and vertical dashed lines show the IWA and OWA of the CGI at λ = 575 nm for the optimistic (green), intermediate (yellow), and pessimistic (red) configurations (Table 1). Regions in green are the detectability windows in the optimistic CGI configuration at this wavelength, and the green histograms in the right panels show the posterior distributions of αobs for this scenario.
Current usage metrics show cumulative count of Article Views (full-text article views including HTML views, PDF and ePub downloads, according to the available data) and Abstracts Views on Vision4Press platform.
Data correspond to usage on the plateform after 2015. The current usage metrics is available 48-96 hours after online publication and is updated daily on week days.
Initial download of the metrics may take a while.