Fig. 4
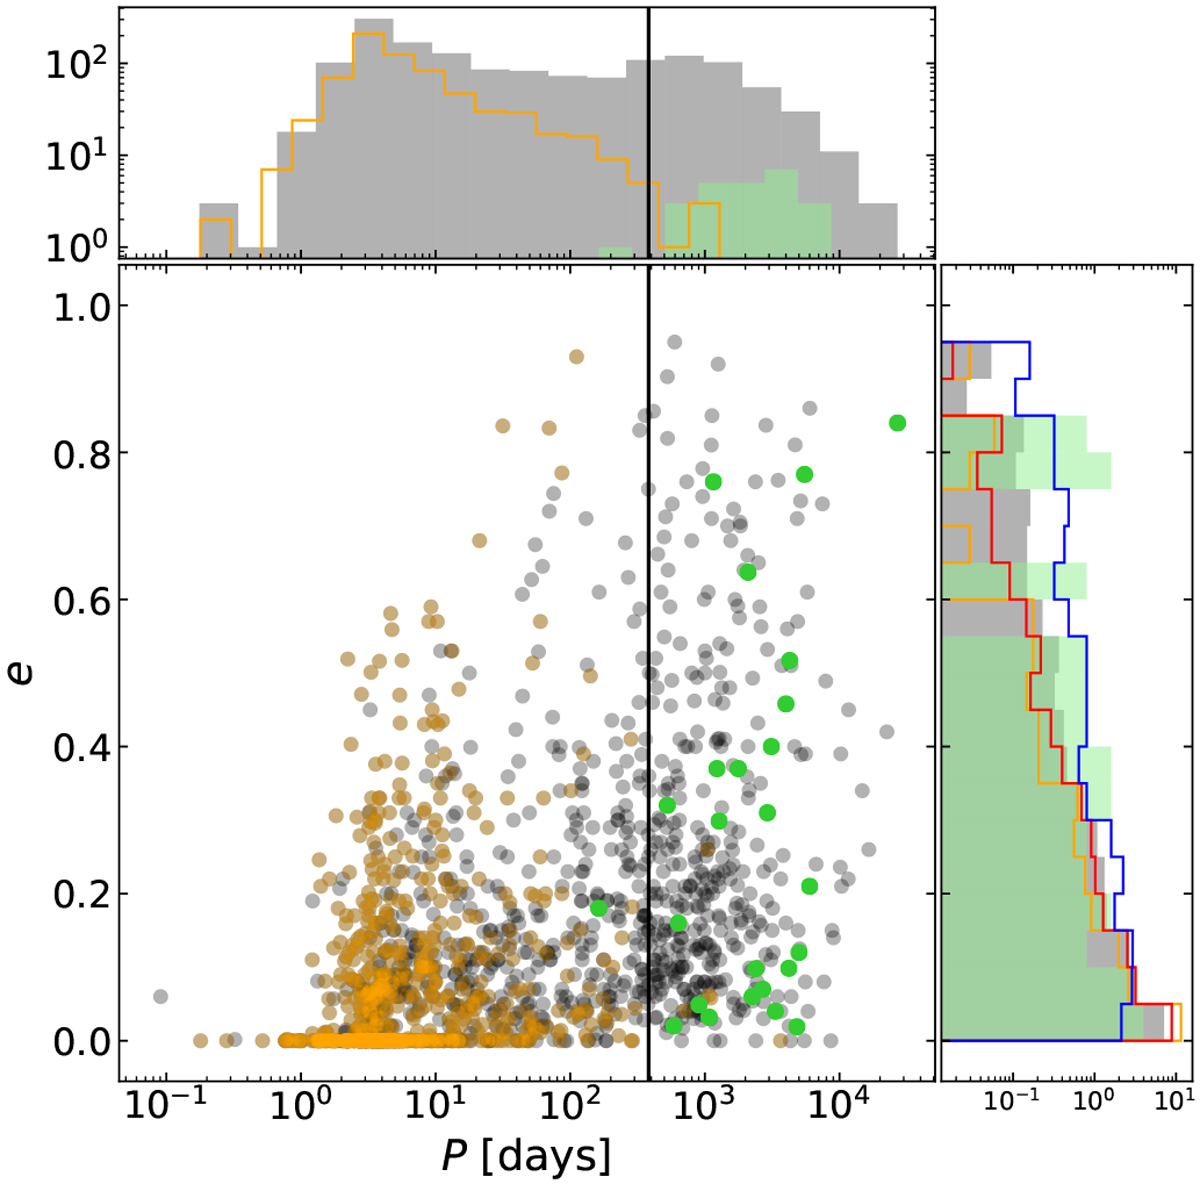
Eccentricity and orbital period for all confirmed exoplanets (grey dots in the main panel), those that have been observed in transit (regardless of whether they were discovered by that method; orange dots) and those that are Roman-accessible in the optimistic CGI configuration, with Paccess > 25% and V < 7 mag (green dots). We only consider those planets for which e is known and P can be derived as explained in Sect. 4.1. The black line shows the limit between short- and long-period exoplanets (P = 382.3 days) as defined in Kipping (2013) (see Sect. 4.1.2). Top panel: P distribution of all confirmed exoplanets (grey), those observed in transit (orange line), and those that are Roman-accessible (semi-transparent green). Right panel: normalized distribution of e such that it shows the relative frequency instead of the total count of planets. The same colour code applies as for the top panel. The green bars are semi-transparent (so that the grey distribution underneath can also be seen), so that the overall graph becomes either darker or lighter green depending on whether the two histograms overlap. For reference, we include the eccentricity for the subsets of short- and long-period exoplanets in Kipping (2013; red and blue lines, respectively).
Current usage metrics show cumulative count of Article Views (full-text article views including HTML views, PDF and ePub downloads, according to the available data) and Abstracts Views on Vision4Press platform.
Data correspond to usage on the plateform after 2015. The current usage metrics is available 48-96 hours after online publication and is updated daily on week days.
Initial download of the metrics may take a while.