Fig. 12
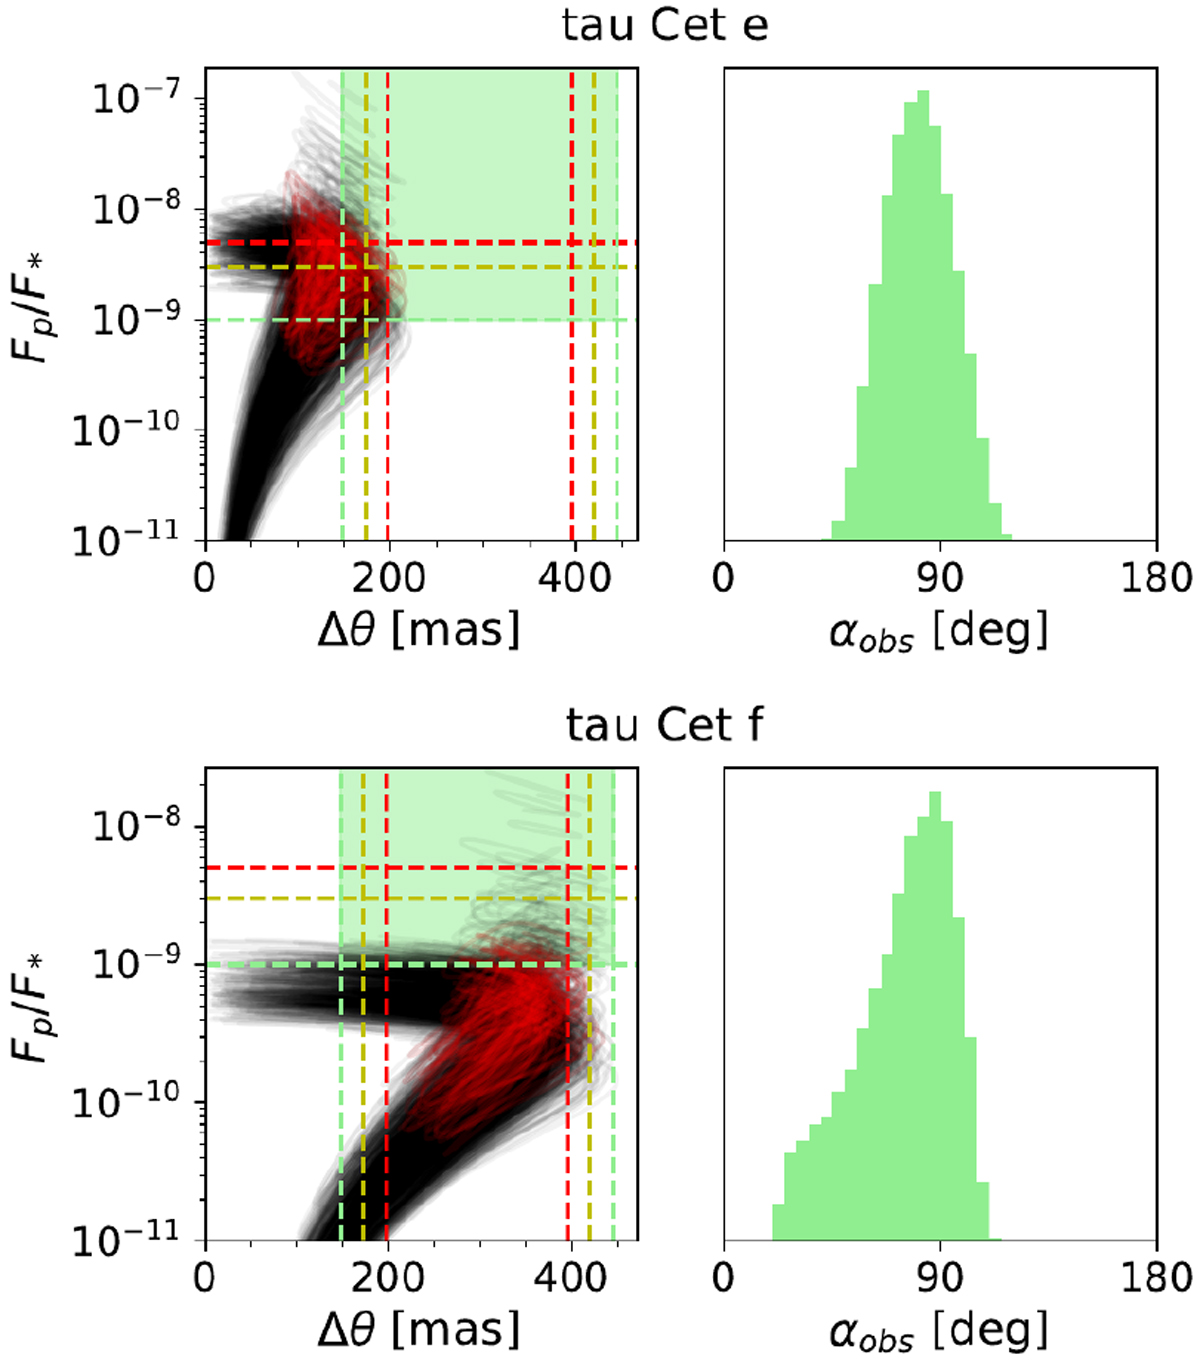
Detectability of tau Cet e and f in each CGI configuration, following the same colour code as in Fig. 8. In the left panels, black lines correspond to orbital realizations without an inclination constraint. Solid red lines correspond to orbital configurations with 25° < i < 45°, coplanar with the debris disc of the system (Lawler et al. 2014). For this case, the inclination is sampled from a uniform distributionwithin the quoted limits. The green histograms in the right panels show the posterior distributions of αobs.
Current usage metrics show cumulative count of Article Views (full-text article views including HTML views, PDF and ePub downloads, according to the available data) and Abstracts Views on Vision4Press platform.
Data correspond to usage on the plateform after 2015. The current usage metrics is available 48-96 hours after online publication and is updated daily on week days.
Initial download of the metrics may take a while.