Fig. 9.
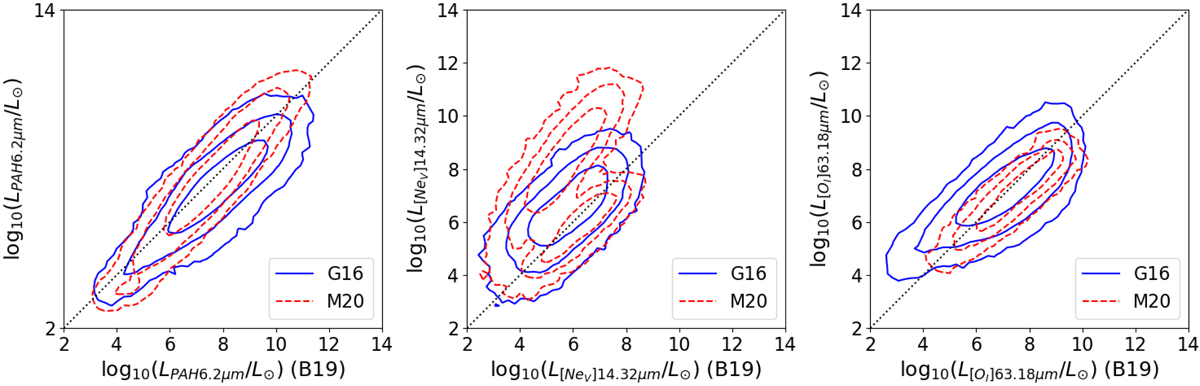
Comparison between the line luminosities derived using the relation by Bonato et al. (2019, B19, x-axis) with those derived with the relations by Gruppioni et al. (2016, blue solid lines) and Mordini et al. (in prep., red dashed lines). The contour lines indicate the 68%, 95%, and 99.7% percentiles of the distribution. The three panels show three different lines: PAH at 3.3 μm (left), [Ne V] 14.32 μm (centre), and [O I] 63.18 μm (right). The relations may be different for AGN and star-forming dominated systems, as explained in the text.
Current usage metrics show cumulative count of Article Views (full-text article views including HTML views, PDF and ePub downloads, according to the available data) and Abstracts Views on Vision4Press platform.
Data correspond to usage on the plateform after 2015. The current usage metrics is available 48-96 hours after online publication and is updated daily on week days.
Initial download of the metrics may take a while.