Fig. 8.
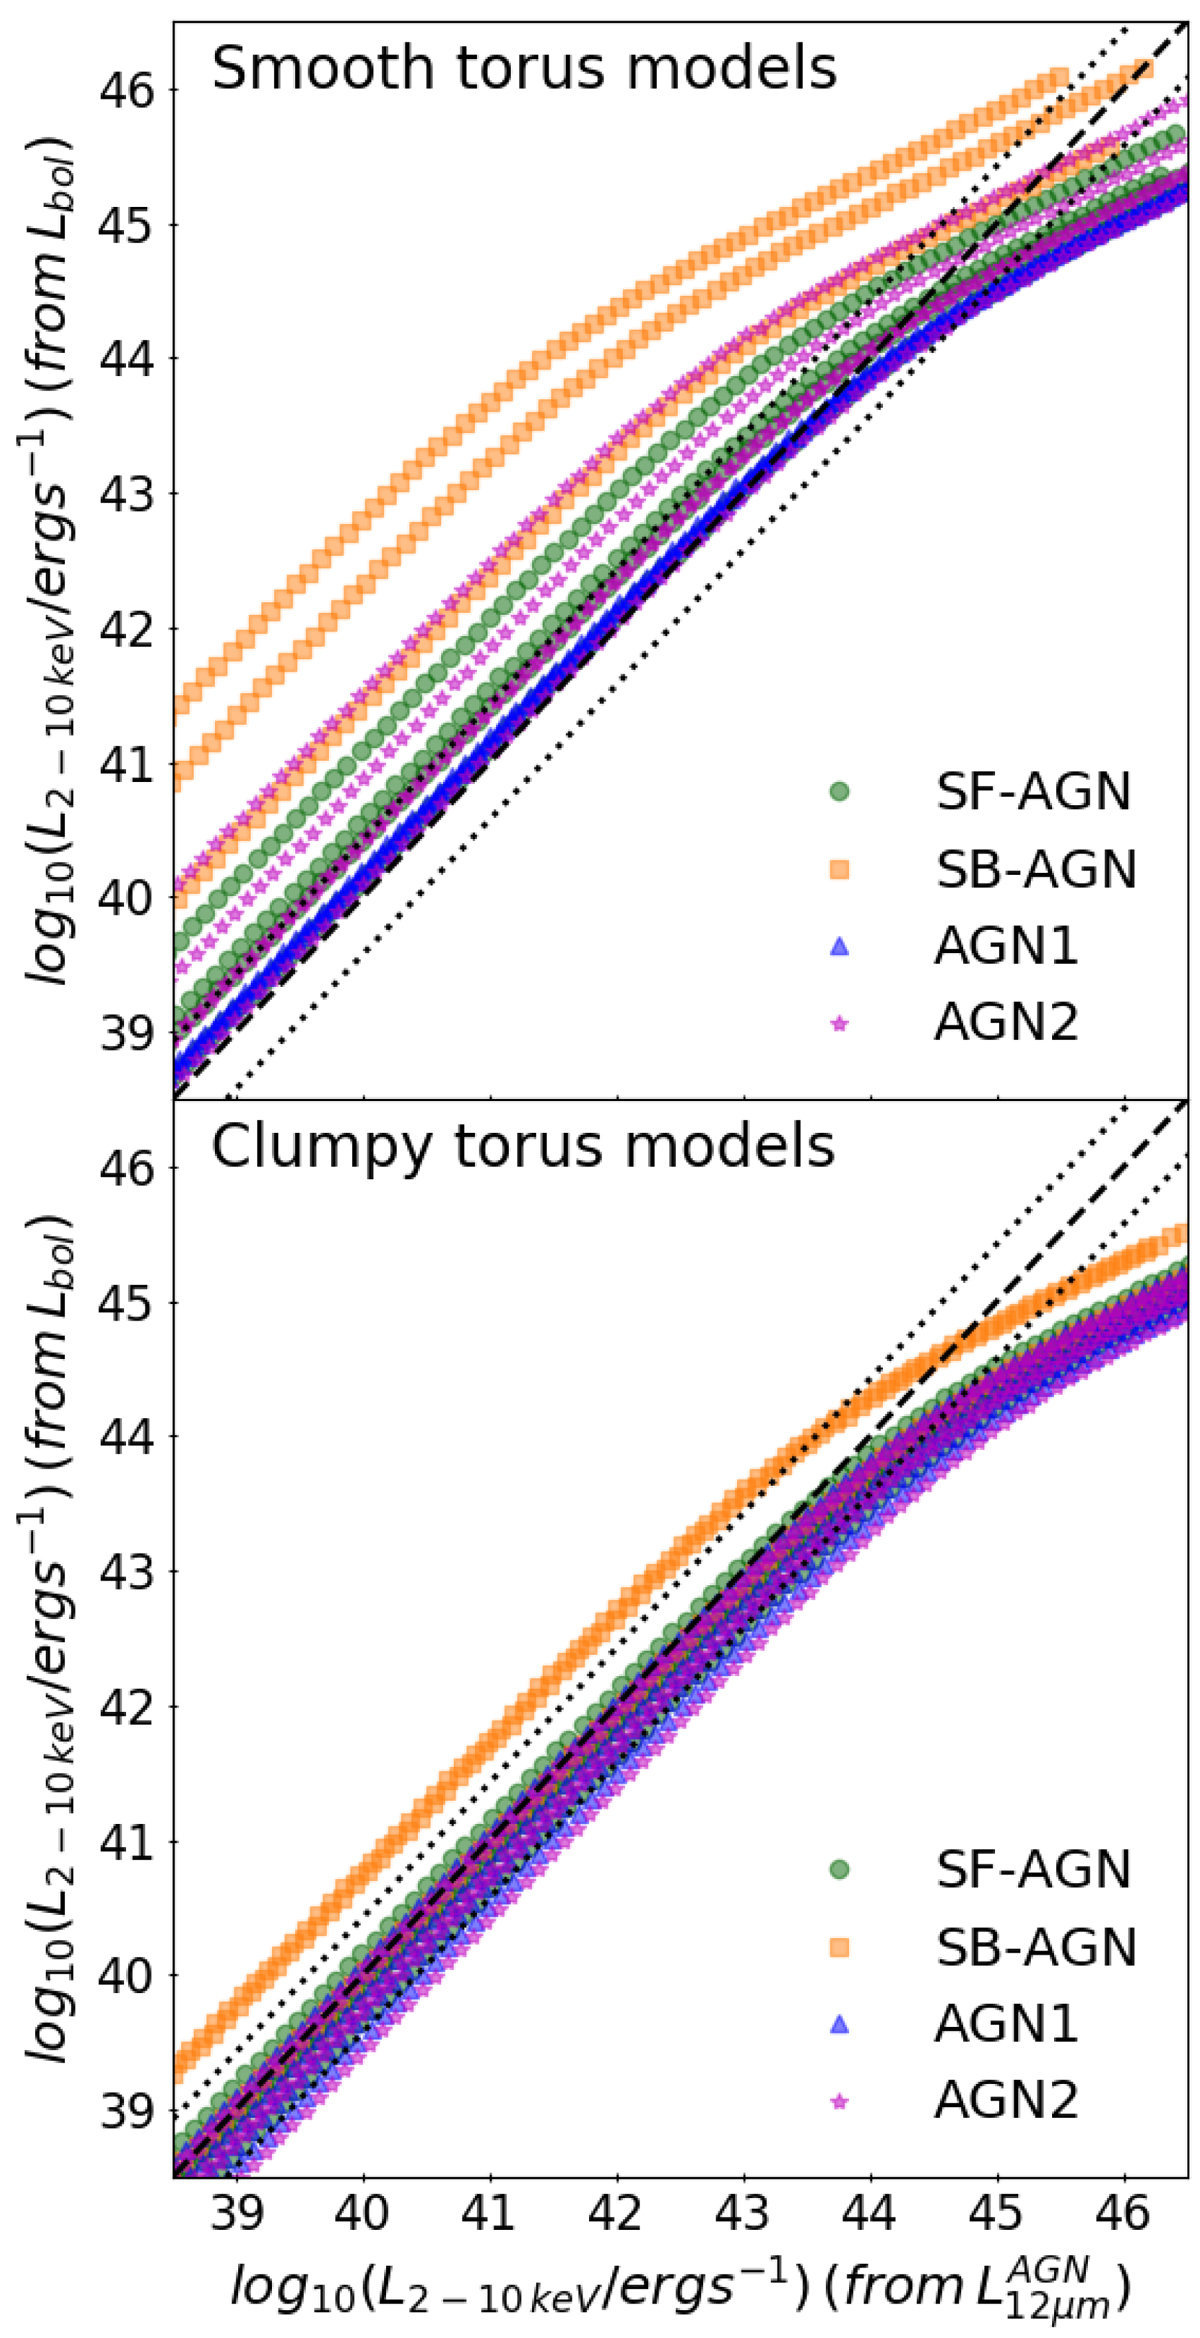
Comparison between the X-ray luminosity obtained from the luminosity at 12 μm (Asmus et al. 2015) and the X-ray luminosity obtained from the AGN bolometric luminosity and assuming the correction by Duras et al. (2020). The comparison is shown separately for the smooth (top) and clumpy torus models (bottom). The different colours indicate the galaxy populations with an AGN component (see legend). The X-ray luminosities are compared before applying any dispersion and are shown for the smooth (top) and clumpy torus models (bottom). The dashed black line indicates the identity line while the dotted lines show the 1σ combined dispersion of the two relations.
Current usage metrics show cumulative count of Article Views (full-text article views including HTML views, PDF and ePub downloads, according to the available data) and Abstracts Views on Vision4Press platform.
Data correspond to usage on the plateform after 2015. The current usage metrics is available 48-96 hours after online publication and is updated daily on week days.
Initial download of the metrics may take a while.