Fig. A.2.
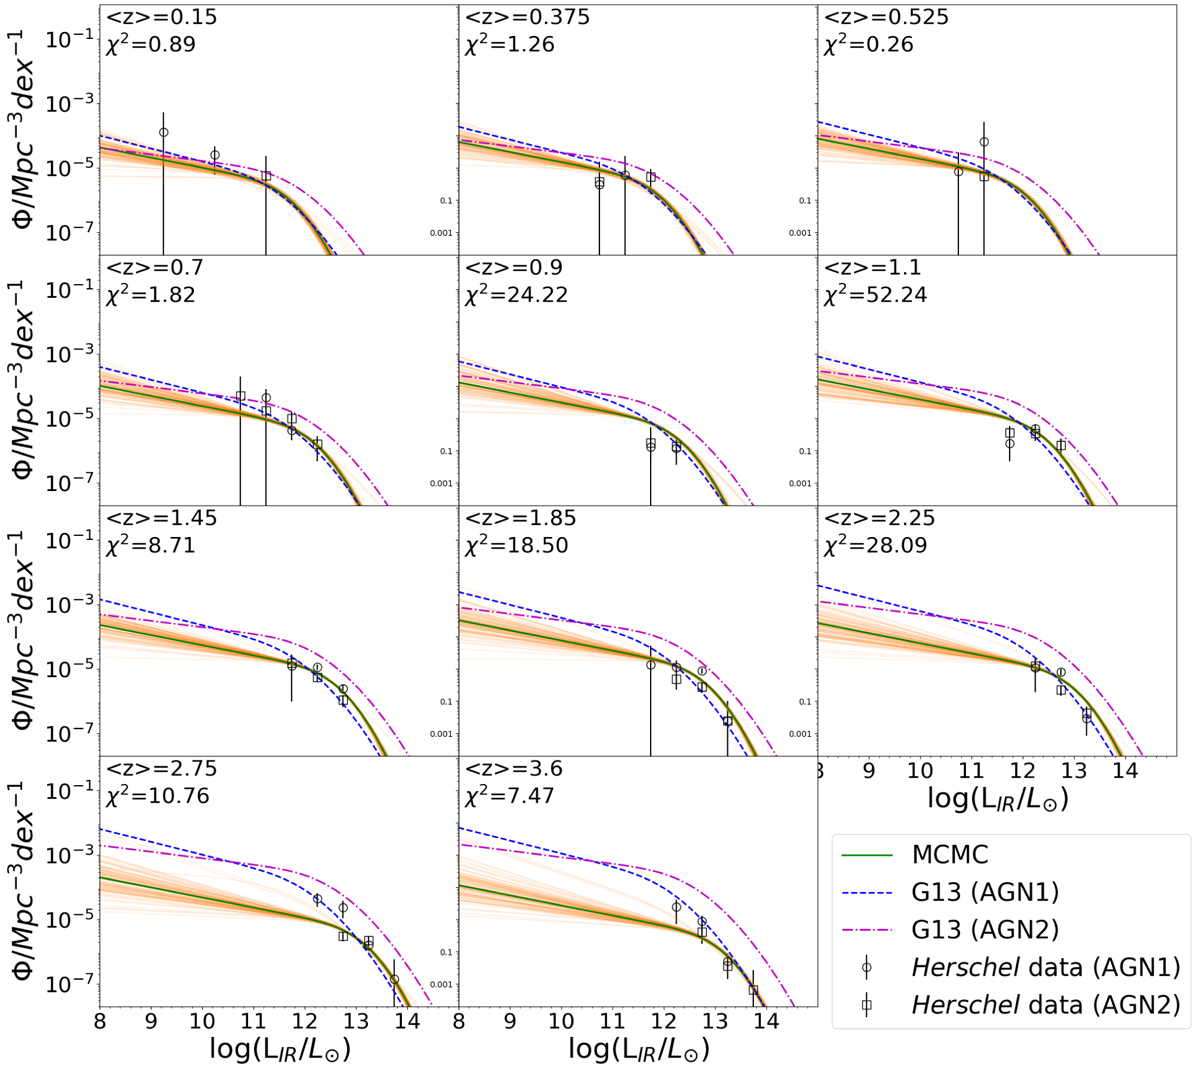
MCMC best result (solid green line) compared with AGN1 (black circles) and AGN2 (black squares) IR Herschel data and the AGN1 (dashed blue line) and AGN2 (dot-dashed magenta line) IR LF by G13. The orange lines are random extractions within 1σ uncertainty of the MCMC results. On the top left of each panel the average redshift and the χ2 are reported.
Current usage metrics show cumulative count of Article Views (full-text article views including HTML views, PDF and ePub downloads, according to the available data) and Abstracts Views on Vision4Press platform.
Data correspond to usage on the plateform after 2015. The current usage metrics is available 48-96 hours after online publication and is updated daily on week days.
Initial download of the metrics may take a while.