Fig. 27.
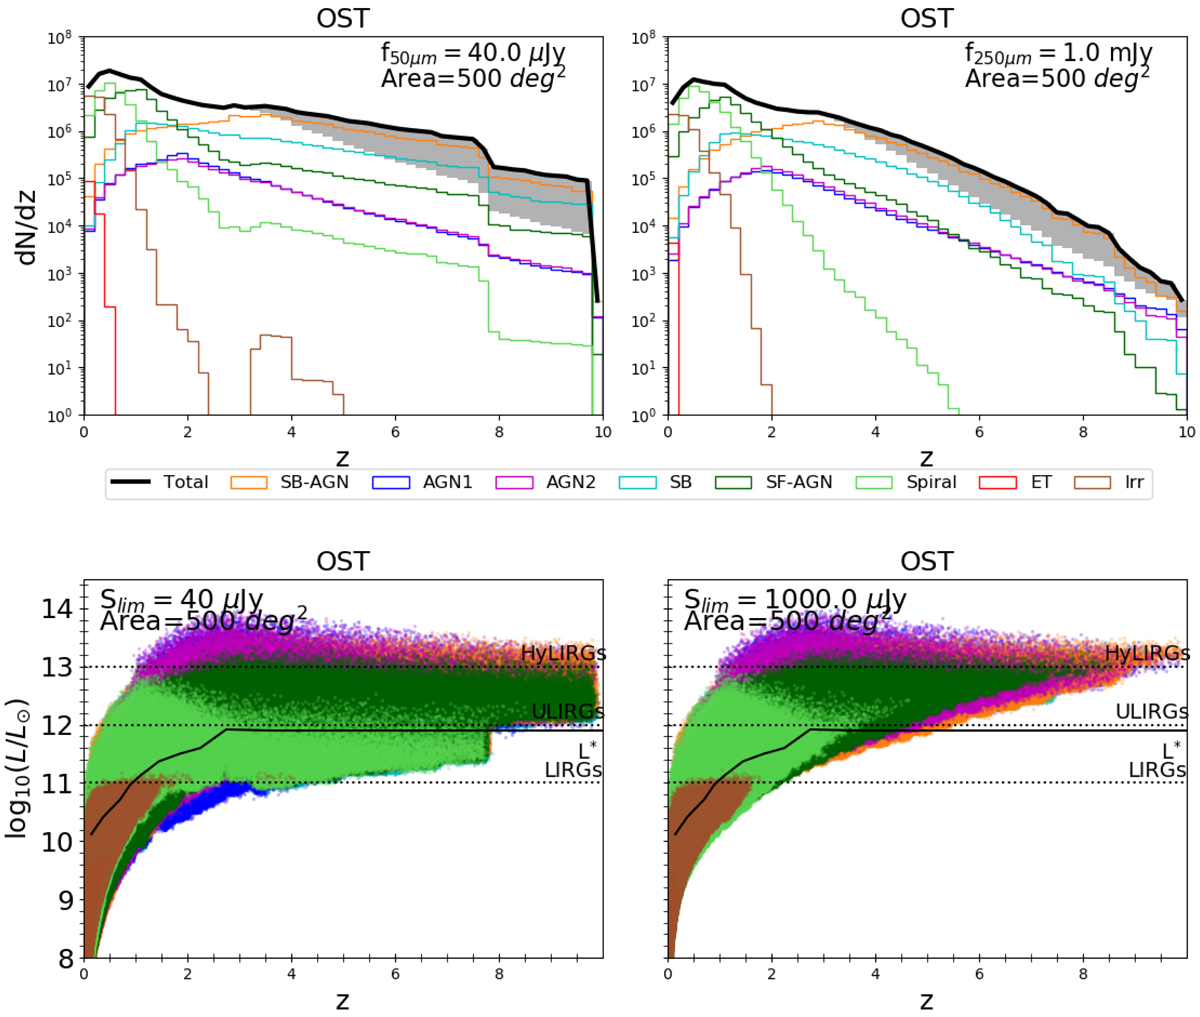
Redshift distribution (top) and LIR vs. redshift (bottom) of the OST simulated catalogues covering 500 deg2. Galaxies detected in both photometric filters, that is the band centred at 50 μm (left) and that centred at 250 μm (right), are represented. The different colours indicate different galaxy populations, as listed in the legend. On the top, the grey shaded area indicates uncertainties due to the high-z extrapolation of the different LFs.
Current usage metrics show cumulative count of Article Views (full-text article views including HTML views, PDF and ePub downloads, according to the available data) and Abstracts Views on Vision4Press platform.
Data correspond to usage on the plateform after 2015. The current usage metrics is available 48-96 hours after online publication and is updated daily on week days.
Initial download of the metrics may take a while.