Fig. 24.
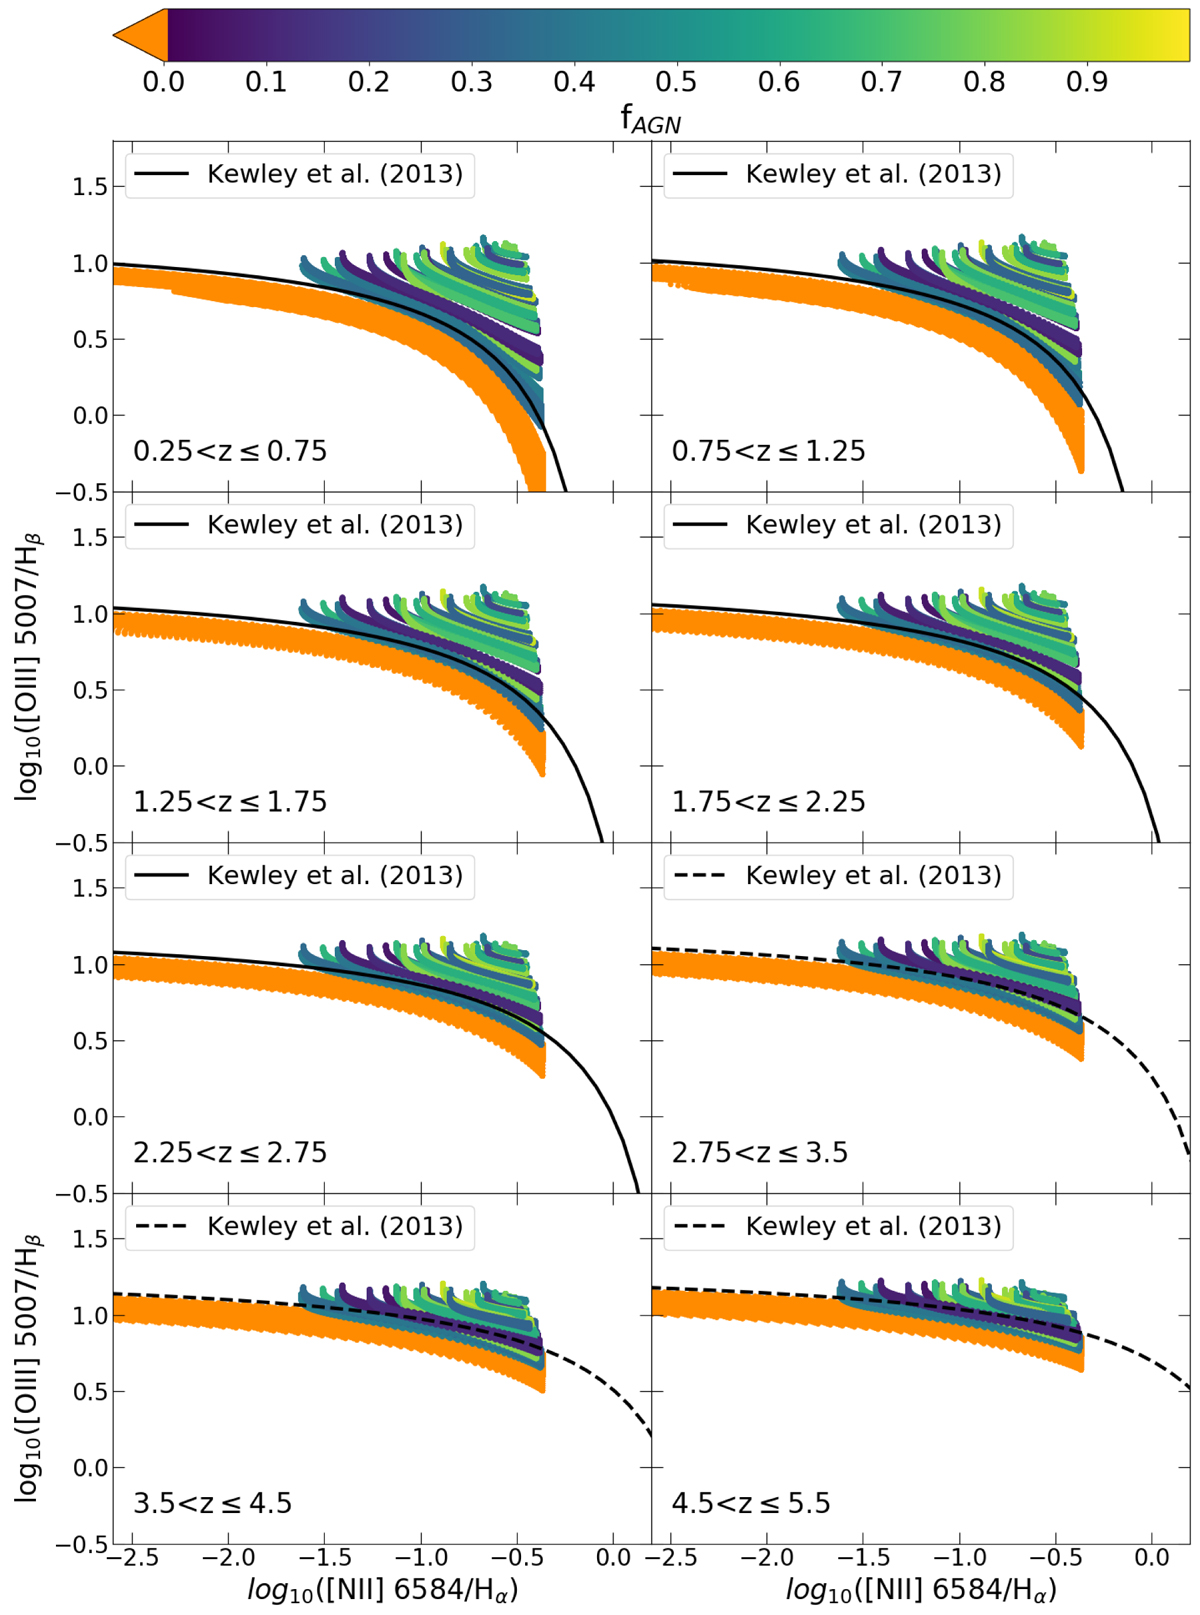
BPT diagram for simulated galaxies. Data points are colour coded depending on the fraction of AGN measured in the IR. The solid black line shows the separation between AGN and H II region, as derived by Kewley et al. (2013b) at z ≤ 2.5. The dashed black line indicates the extrapolation of the same separation criteria at high reshifts.
Current usage metrics show cumulative count of Article Views (full-text article views including HTML views, PDF and ePub downloads, according to the available data) and Abstracts Views on Vision4Press platform.
Data correspond to usage on the plateform after 2015. The current usage metrics is available 48-96 hours after online publication and is updated daily on week days.
Initial download of the metrics may take a while.