Fig. 21.
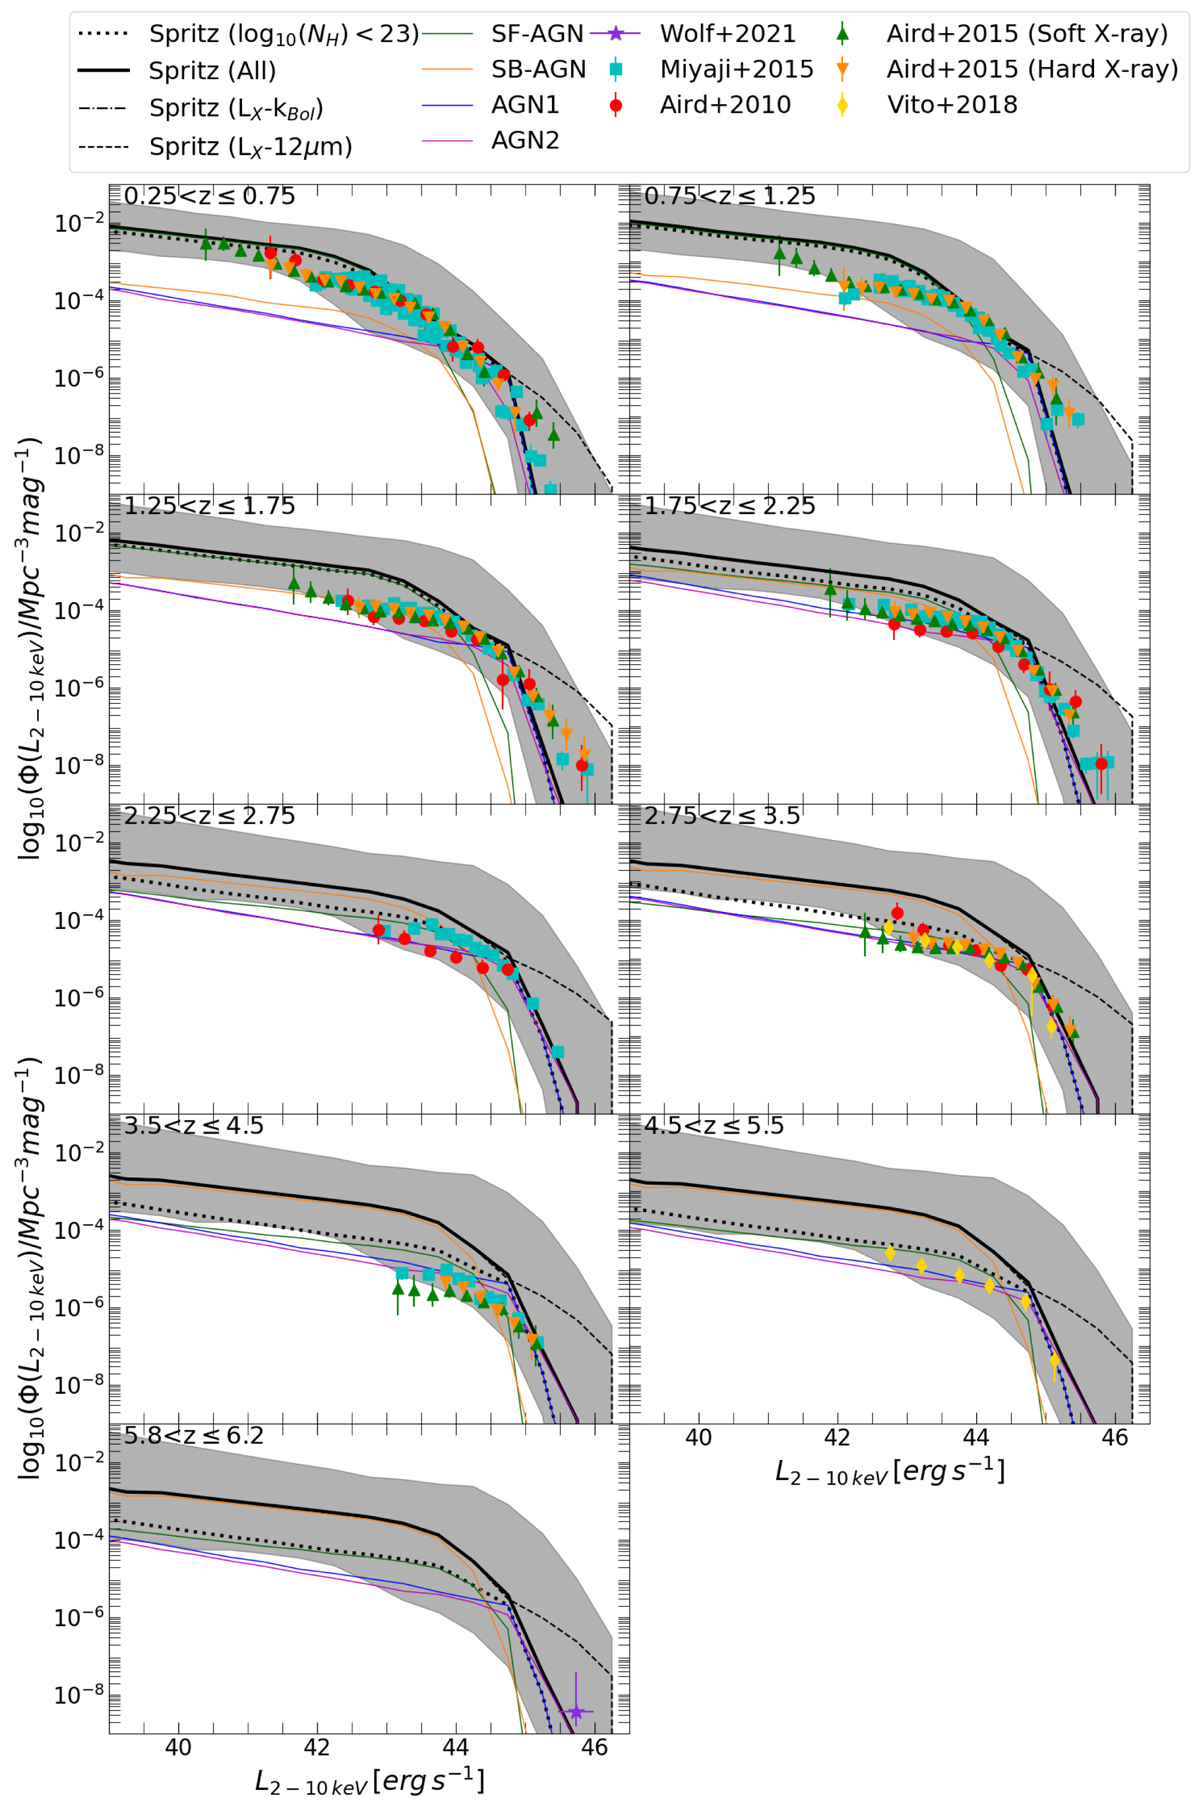
Luminosity function at 2–10 keV for all AGN simulated with SPRITZ (solid black line) with high-redshift extrapolation kΦ = −1 (Eq. (2)) and for the sub-sample of AGN with log10(NH/cm−2) < 23 (dotted black line). The grey area shows the uncertainties due to the conversion from the L12 μm to L2 − 10 keV, the use of different torus models, and the 1σ errors of the IR LFs used to derive the simulated galaxies hosting an AGN. The LF for each different sub-population is also shown (see Fig. 17). The observed X-ray LFs by Wolf et al. (2021, purple star), Miyaji et al. (2015, cyan squares), Aird et al. (2010, red circles), Aird et al. (2015, green and orange triangles), and Vito et al. (2018, yellow diamonds) are reported.
Current usage metrics show cumulative count of Article Views (full-text article views including HTML views, PDF and ePub downloads, according to the available data) and Abstracts Views on Vision4Press platform.
Data correspond to usage on the plateform after 2015. The current usage metrics is available 48-96 hours after online publication and is updated daily on week days.
Initial download of the metrics may take a while.