Fig. 19.
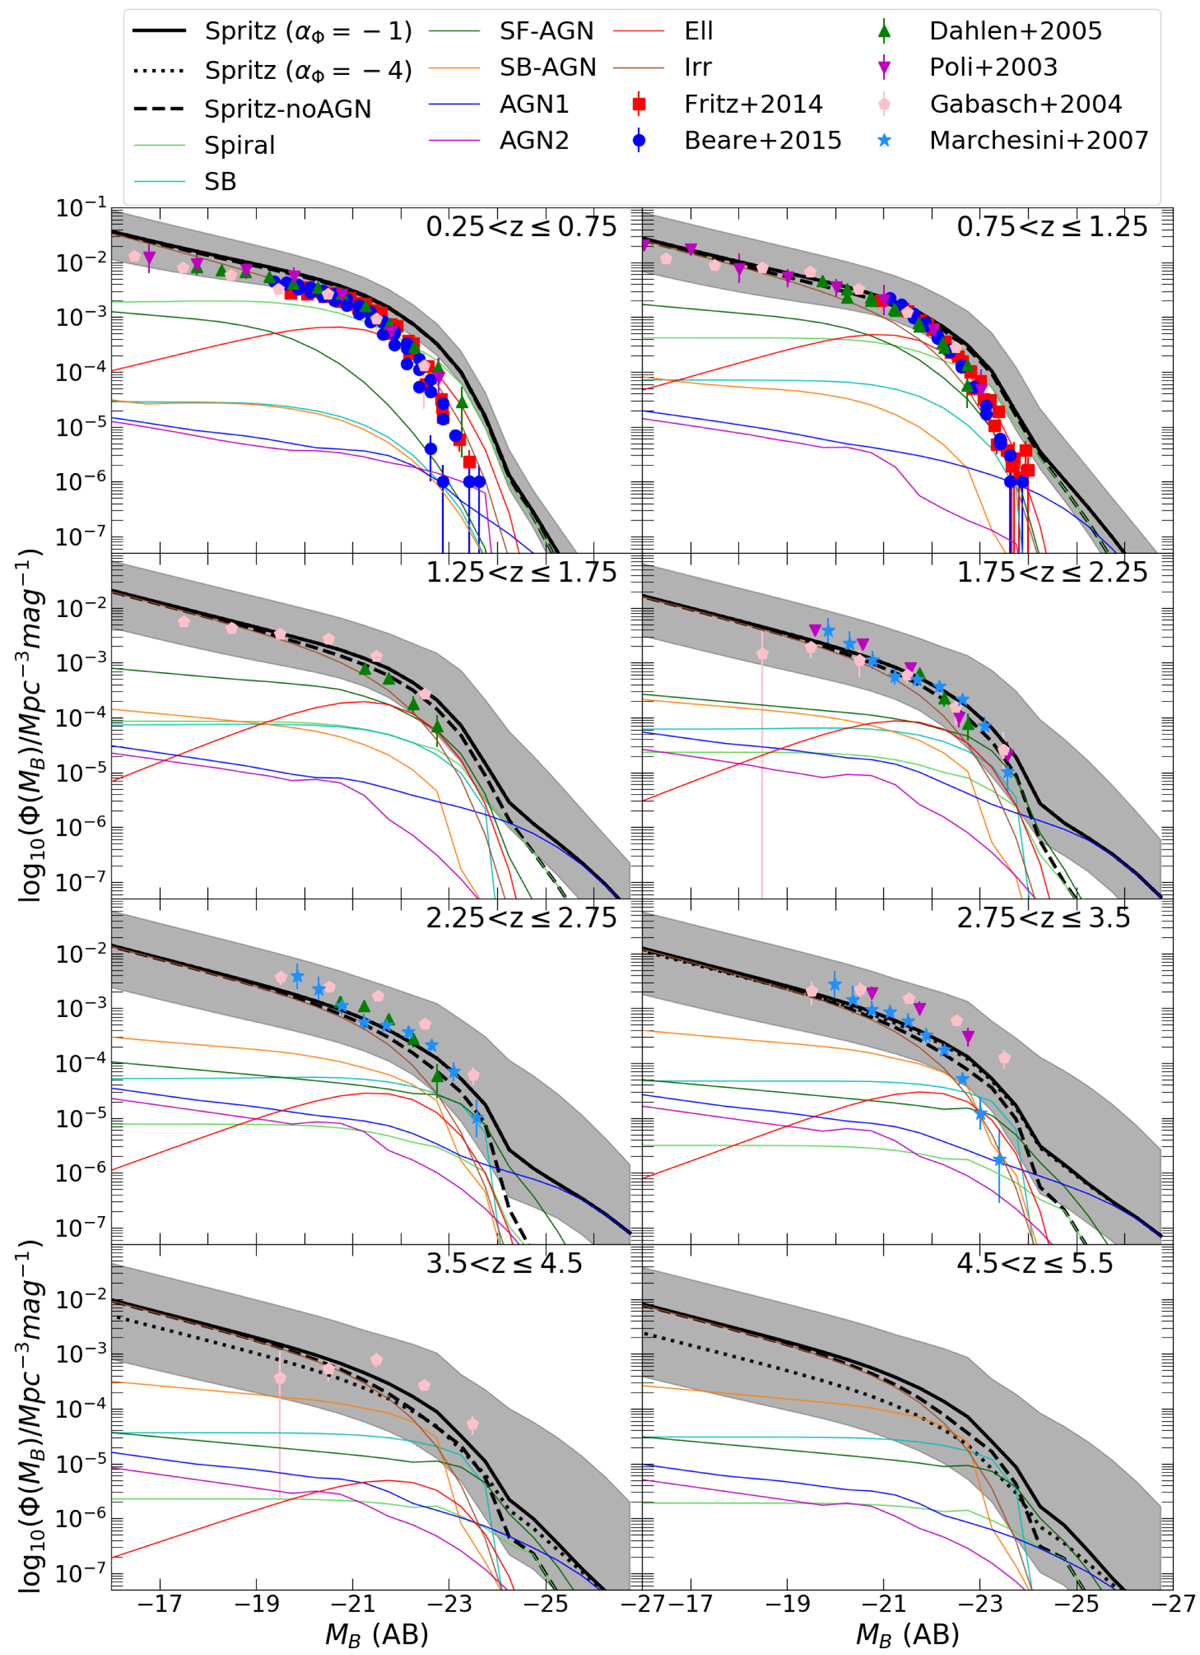
Same as Fig. 17, but for the B-band LF. The observed B-band LFs are represented by Fritz et al. (2014, red squares), Beare et al. (2015, blue circles), Dahlen et al. (2005, green triangles), Poli et al. (2003, magenta upside-down triangles), Gabasch et al. (2004, pink pentagon), and Marchesini et al. (2007, light blue stars) in the overlapping redshift bins.
Current usage metrics show cumulative count of Article Views (full-text article views including HTML views, PDF and ePub downloads, according to the available data) and Abstracts Views on Vision4Press platform.
Data correspond to usage on the plateform after 2015. The current usage metrics is available 48-96 hours after online publication and is updated daily on week days.
Initial download of the metrics may take a while.