Fig. 17.
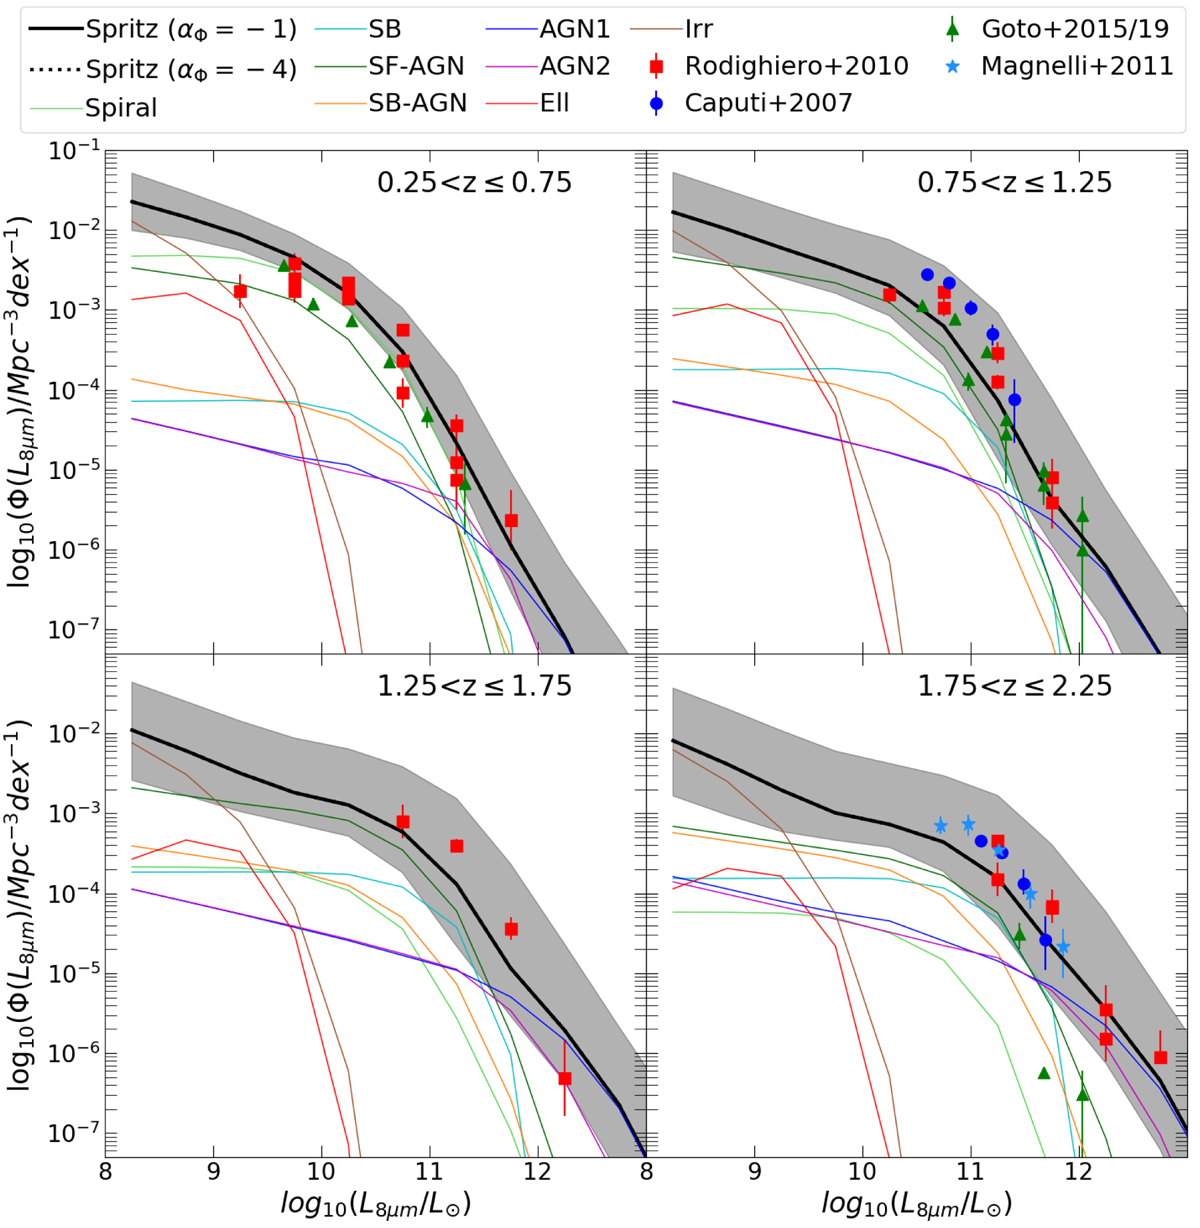
Luminosity function at 8 μm for all galaxies simulated with SPRITZ (solid black tick line), with high-redshift extrapolation kΦ = −1 (Eq. (2)). The grey area shows the uncertainties due to the high-z extrapolation and 1σ errors of the GSFM, IR, and K-band LFs used to generate simulated galaxies. The LF for the different sub-populations is also shown: spirals (green line), SBs (cyan line), the two composite populations SF-AGN (dark green line) and SB-AGN (orange line), AGN type-1 (blue line), AGN type-2 (magenta line), elliptical galaxies (red line), and irregular galaxies (brown line). The observed 8 μm LFs by Rodighiero et al. (2010, red squares), Caputi et al. (2007, blue circles), Goto et al. (2015, 2019, green triangles), and Magnelli et al. (2011, light blue stars) are also represented.
Current usage metrics show cumulative count of Article Views (full-text article views including HTML views, PDF and ePub downloads, according to the available data) and Abstracts Views on Vision4Press platform.
Data correspond to usage on the plateform after 2015. The current usage metrics is available 48-96 hours after online publication and is updated daily on week days.
Initial download of the metrics may take a while.