Fig. 16.
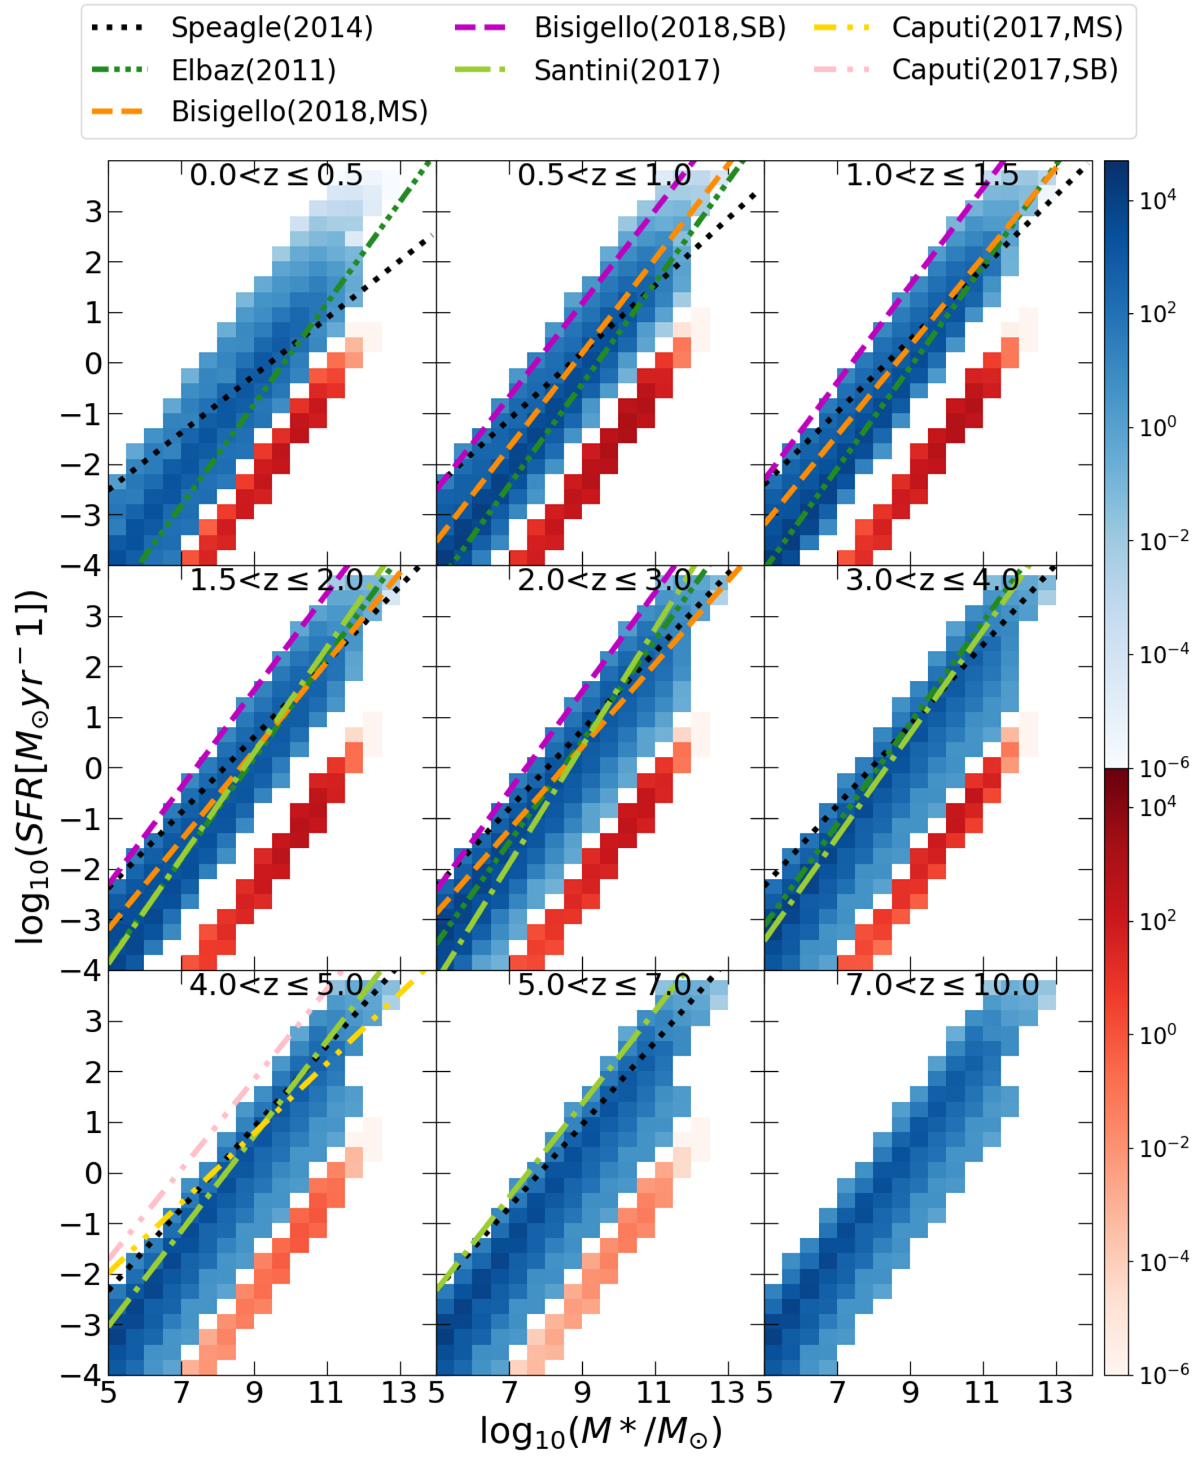
Stellar mass vs. SFR at different redshifts for simulated SPRITZ galaxies with high-redshift extrapolation kΦ = −1 (Eq. (2)). Blue shows the distribution of galaxies derived from the IR LF or the irregular GSFM, while red indicates the distribution of elliptical galaxies derived from the K-band LF. The colour gradients show the number of galaxy in 1 deg2 and these are in logarithmic scale, as shown on the right for star-forming galaxies (top colour bar) and ellipticals (bottom colour bar). The different lines show the observed position of normal star-forming galaxies as derived by Elbaz et al. (2011, dash-dot-dot-dotted green line), Speagle et al. (2014, dotted black line), Caputi et al. (2017, dash-dot-dotted yellow line), Santini et al. (2017, dash-dotted light green line), Bisigello et al. (2018, dashed orange line), and the relation derived for SBs by Caputi et al. (2017, pink dash-dot-dotted lines) and Bisigello et al. (2018, magenta dashed lines).
Current usage metrics show cumulative count of Article Views (full-text article views including HTML views, PDF and ePub downloads, according to the available data) and Abstracts Views on Vision4Press platform.
Data correspond to usage on the plateform after 2015. The current usage metrics is available 48-96 hours after online publication and is updated daily on week days.
Initial download of the metrics may take a while.