Fig. 15.
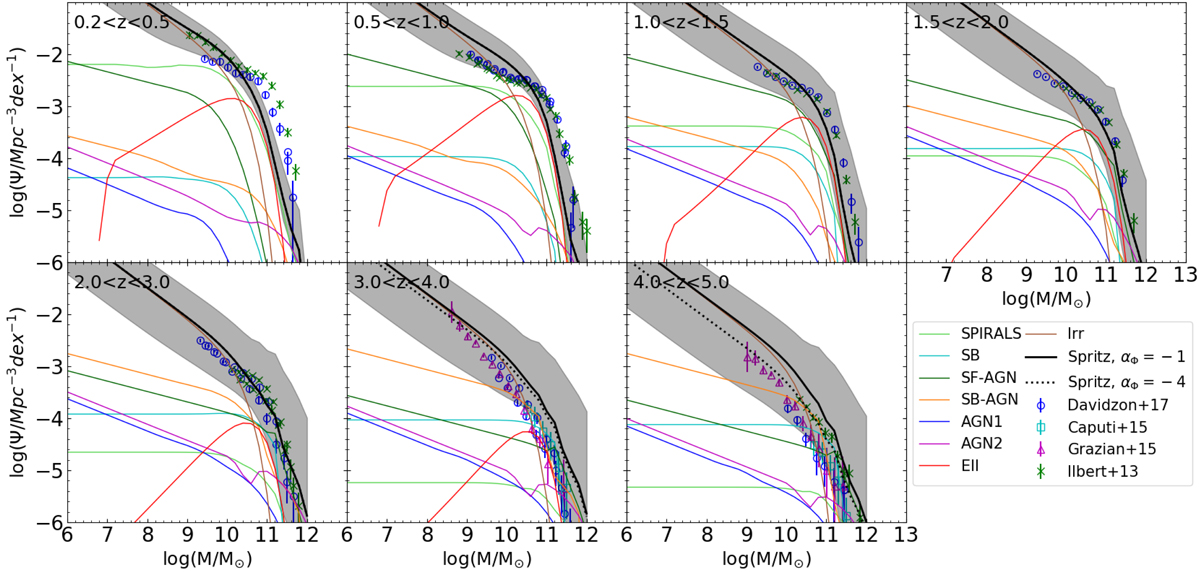
Stellar mass function of the SPRITZ simulation at different redshifts (thick solid black line), with high-redshift extrapolation kΦ = −1 (Eq. (2)) and −4 (thick dotted black line). The grey shaded area shows the uncertainties arising from the high-z extrapolation, the different torus library considered, the 1σ value derived from the probability distribution of the stellar mass of each SED template, and the 1σ errors of the LFs and GSMF used to derive simulated galaxies. Some of the values present in the literature are reported: Ilbert et al. (2013, green crosses), Davidzon et al. (2017, blue circles), Caputi et al. (2015, cyan squares) and Grazian et al. (2015, magenta triangles). The thin coloured lines represent the stellar mass functions for the different galaxy populations considered in SPRITZ: spirals (light green line), SBs (cyan line), SF-AGN (dark green line), SB-AGN (orange line), AGN type-1 (blue line), AGN type-2 (magenta line), elliptical galaxies (red line), and irregular galaxies (brown line).
Current usage metrics show cumulative count of Article Views (full-text article views including HTML views, PDF and ePub downloads, according to the available data) and Abstracts Views on Vision4Press platform.
Data correspond to usage on the plateform after 2015. The current usage metrics is available 48-96 hours after online publication and is updated daily on week days.
Initial download of the metrics may take a while.