Fig. 13.
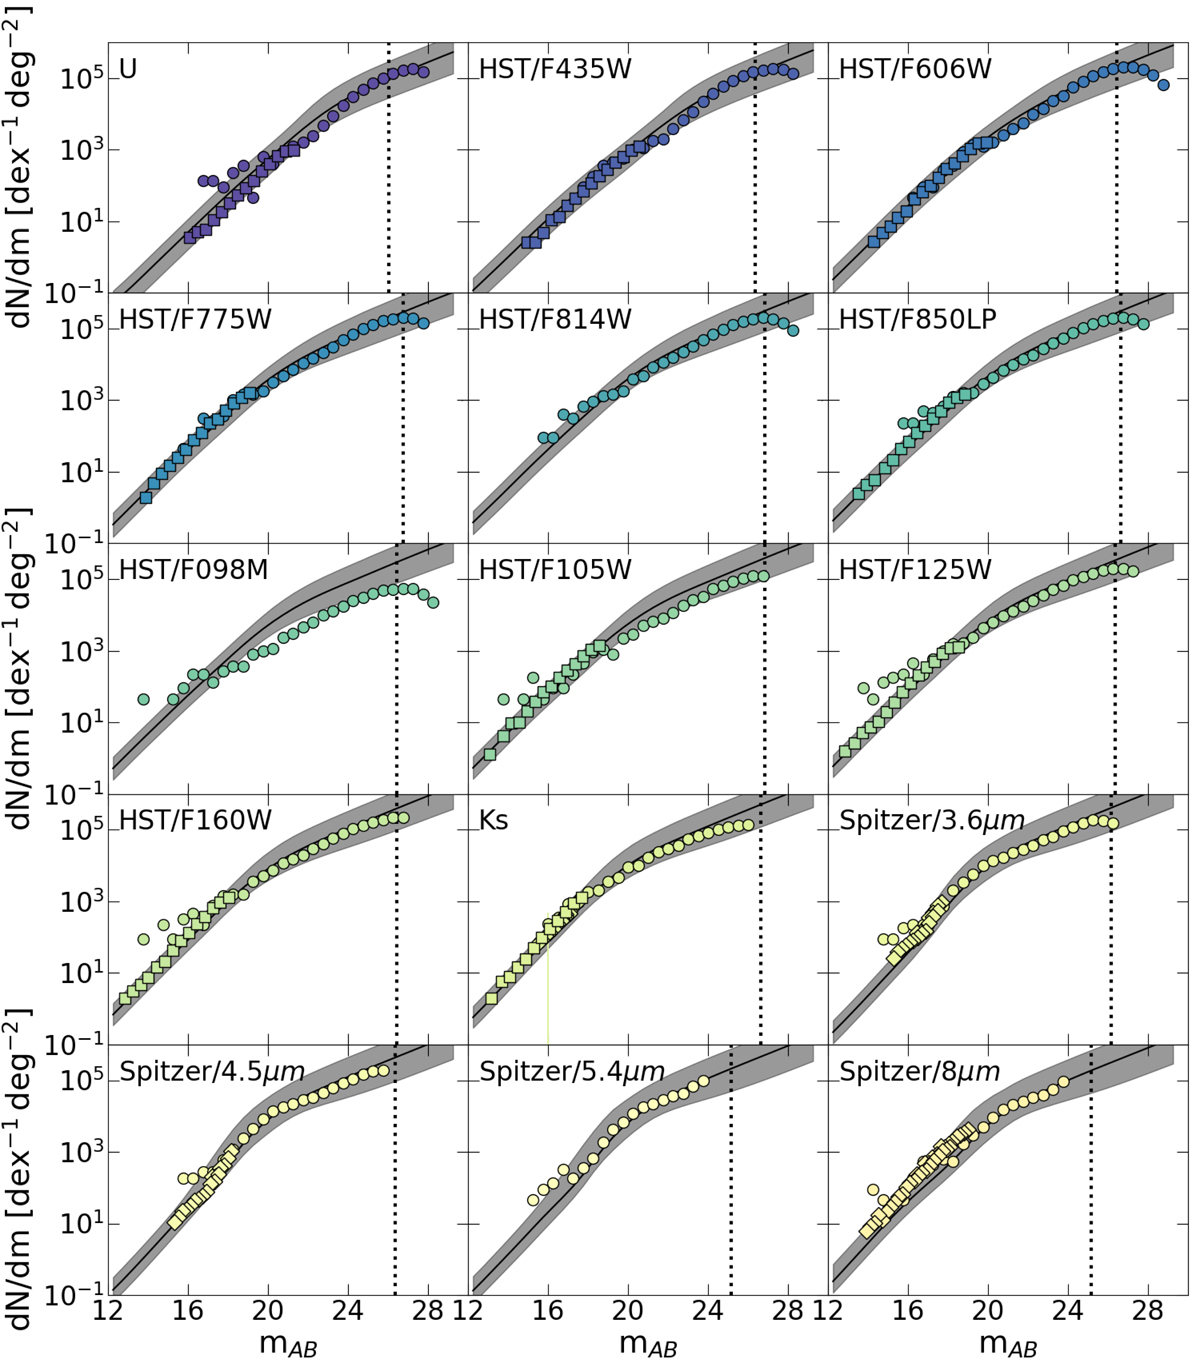
Differential number counts of the SPRITZ simulated galaxies from the U band to the near-IR with high-redshift extrapolation kΦ = −1 (Eq. (2), solid black line). The shaded regions show the uncertainties due to the high-z extrapolation and the 1σ errors of the LFs and GSMF used to generate simulated galaxies. Observations in the same bands of the CANDELS GOODS-S survey (filled circles, Guo et al. 20130 and data from the GAMA survey (filled squares, Hill et al. 2011) and the AKARI telescope (filled diamonds, Murata et al. 2014), both corrected for the differences in the broad-band filters, are also shown. For clarity, only one every four data points of the GAMA survey are shown. The dotted vertical black lines show a rough estimate of the 50% completeness level for CANDELS data.
Current usage metrics show cumulative count of Article Views (full-text article views including HTML views, PDF and ePub downloads, according to the available data) and Abstracts Views on Vision4Press platform.
Data correspond to usage on the plateform after 2015. The current usage metrics is available 48-96 hours after online publication and is updated daily on week days.
Initial download of the metrics may take a while.