Fig. 10.
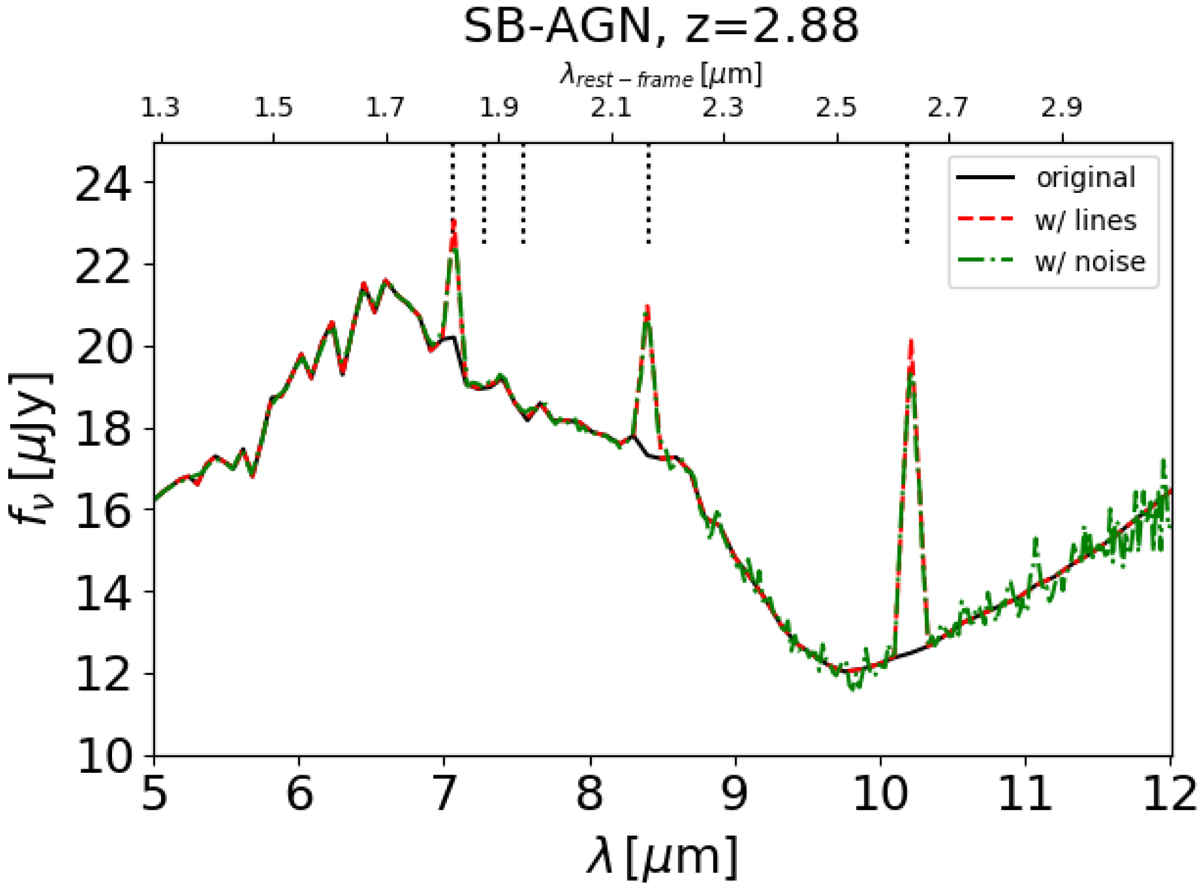
Example of a low-resolution JWST/MIRI spectra of a SB-AGN galaxy at z = 2.88. At the top the rest-frame wavelengths are shown; on the bottom the observed wavelengths are shown. The original spectrum (solid black line), the spectrum after the addition of nebular lines (dashed red line), and the spectrum after the application of the spectral resolution and noise (dotted green line) are shown. On the top, short vertical dotted lines indicate the wavelength position of the nebular emission lines included despite their S/N.
Current usage metrics show cumulative count of Article Views (full-text article views including HTML views, PDF and ePub downloads, according to the available data) and Abstracts Views on Vision4Press platform.
Data correspond to usage on the plateform after 2015. The current usage metrics is available 48-96 hours after online publication and is updated daily on week days.
Initial download of the metrics may take a while.