Fig. 9.
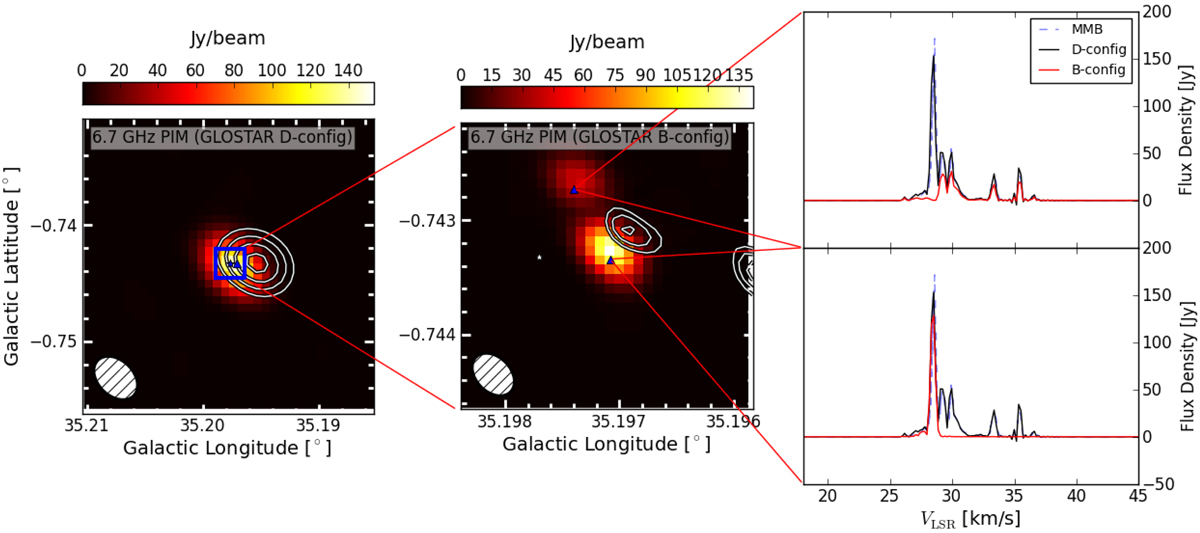
Peak intensity maps (PIM) over the velocity range of the methanol maser source G35.197−0.743 and spectra obtained from VLA data. On the left is the VLA D configuration data, which has an average beamsize of ∼18 arcsec. When observed in the B configuration (with beamsize ∼1.5 arcsec, middle panel), one can see that the higher resolution allows us to resolve the maser into two sources. Viewing the spectra on the right, we see that the first peak at 28.51 km s−1 belongs only to the southern source while the rest belong to the northern source. The white contours mark the GLOSTAR radio continuum emission.
Current usage metrics show cumulative count of Article Views (full-text article views including HTML views, PDF and ePub downloads, according to the available data) and Abstracts Views on Vision4Press platform.
Data correspond to usage on the plateform after 2015. The current usage metrics is available 48-96 hours after online publication and is updated daily on week days.
Initial download of the metrics may take a while.