Fig. 15.
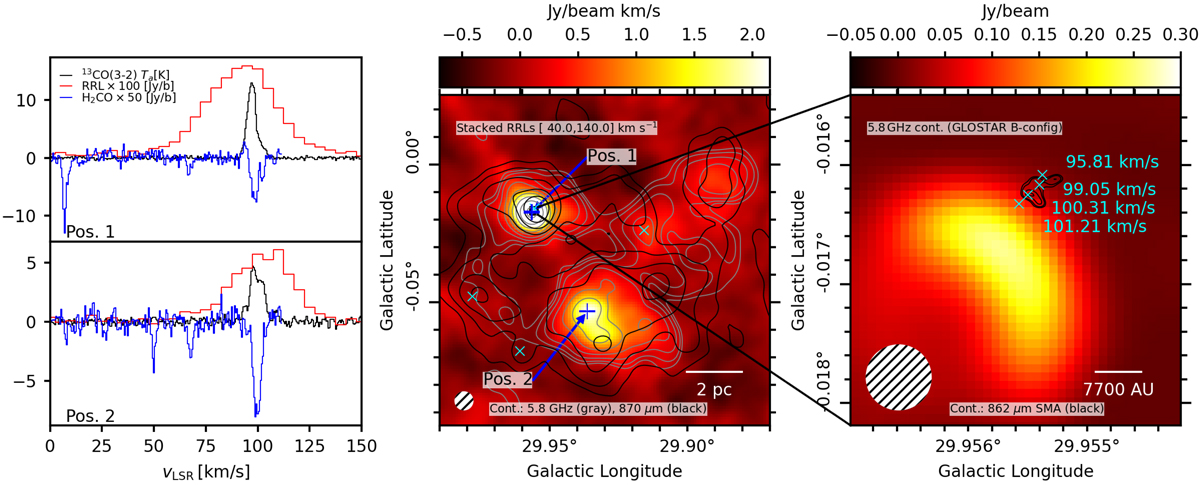
Overview of the RRL emission in the star-forming complex around l = 29.93°, b = −0.03°. The central panel shows integrated emission between 40 and 140 km s−1 after stacking seven RRLs in velocity at 25″ resolution. The GLOSTAR 5.8 GHz D-array continuum is shown (gray contours) always increasing by a factor of two starting from 10 mJy beam−1. ATLASGAL 870 μm emission (Schuller et al. 2009) is shown (black contours) increasing by a factor of two starting from 0.5 Jy beam−1. The positions of extracted spectra in the side panels are indicated with blue crosses; detected CH3OH 6.8 GHz masers are indicated by cyan crosses. The side panels on the left compare the RRL spectra to 13CO (3–2) emission from the CHIMPS survey (Rigby et al. 2016), and to the H2CO absorption at 0.5 km s−1 spectral resolution from GLOSTAR. All data have been smoothed to 25″ resolution. The right panel shows a zoom-in on the cometary H II region G29.96−0.02 in 5.8 GHz continuum emission from the GLOSTAR survey in B configuration at 2″ resolution. Overlaid with cyan crosses are fitted CH3OH maser position peaks at different velocity channels from GLOSTAR (1.4″ × 1.0″). SMA 862 μm emission from Beuther et al. (2007) is shown (black contours) at 83, 105, 147, and 168 mJy beam−1.
Current usage metrics show cumulative count of Article Views (full-text article views including HTML views, PDF and ePub downloads, according to the available data) and Abstracts Views on Vision4Press platform.
Data correspond to usage on the plateform after 2015. The current usage metrics is available 48-96 hours after online publication and is updated daily on week days.
Initial download of the metrics may take a while.