Fig. 9.
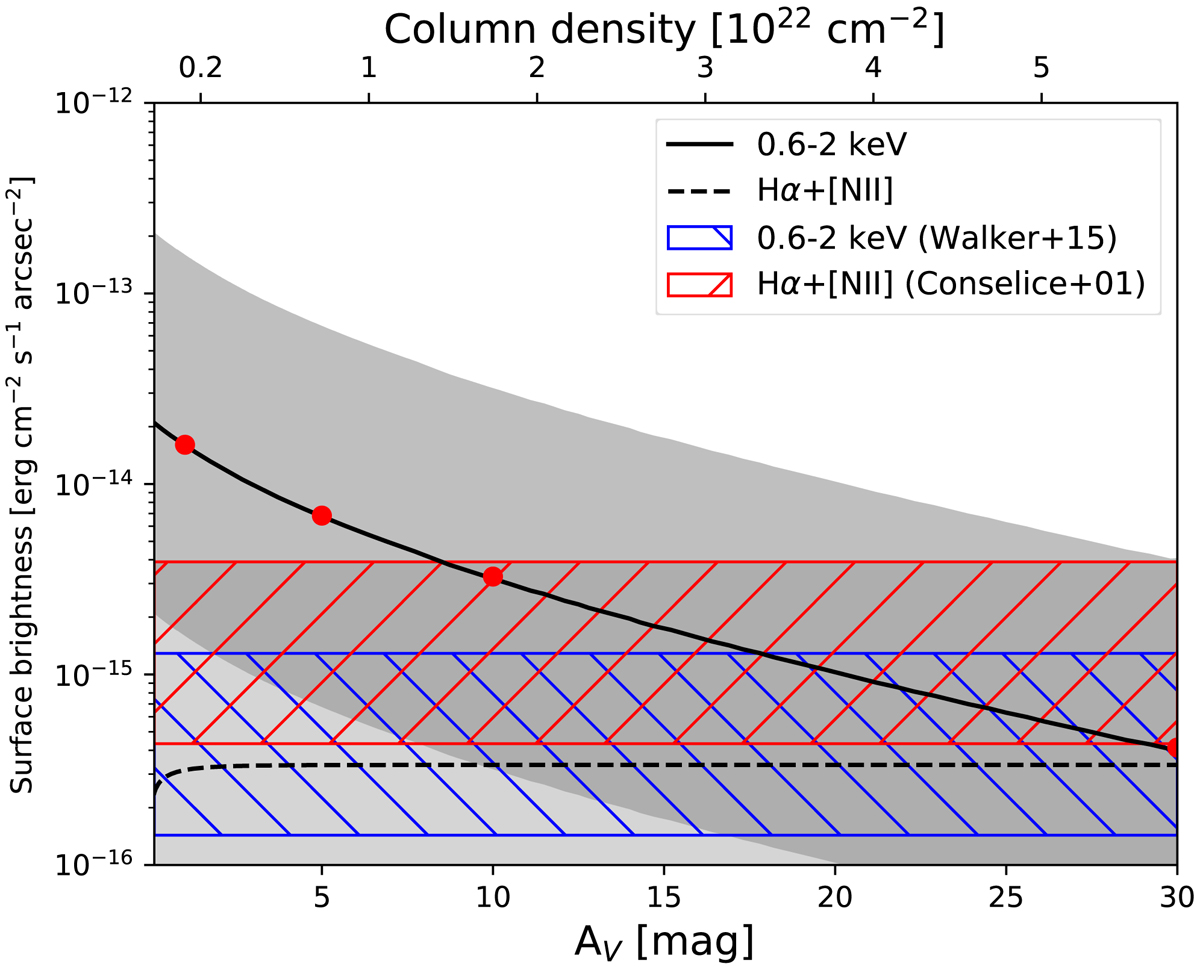
Predicted cumulative surface brightness of Hα+[N II]λ 6548, 6583 Å (dashed line) and predicted ionizing continuum 0.6–2 keV X-ray band (solid line) as a function of AV for a model with GX = 10, vtur = 10 km s−1, and Z = Z⊙. The dark gray and soft gray background show the range of predicted ionizing continuum 0.6–2 keV X-ray and cumulative surface brightness of Hα+[N II]λ 6583 Å, respectively, for models with GX in the range 1–100. The red dots show the predicted transmitted continuum 0.6–2 keV X-ray band estimated at AV = 1, 5, 10, and 30 mag. The area covered by red (blue) diagonal lines represents a factor of three of the observed surface brightness of Hα+[N II]λ 6548, 6583 Å from Conselice et al. (2001) for region 15 of that paper, 1.3 × 10⁻¹⁵ erg cm−2 s−1 arcsec−2 (of 0.6–2 keV X-ray band from Walker et al. 2015, 4.3 × 10⁻¹⁶ erg cm−2 s−1 arcsec−2).
Current usage metrics show cumulative count of Article Views (full-text article views including HTML views, PDF and ePub downloads, according to the available data) and Abstracts Views on Vision4Press platform.
Data correspond to usage on the plateform after 2015. The current usage metrics is available 48-96 hours after online publication and is updated daily on week days.
Initial download of the metrics may take a while.