Fig. 8.
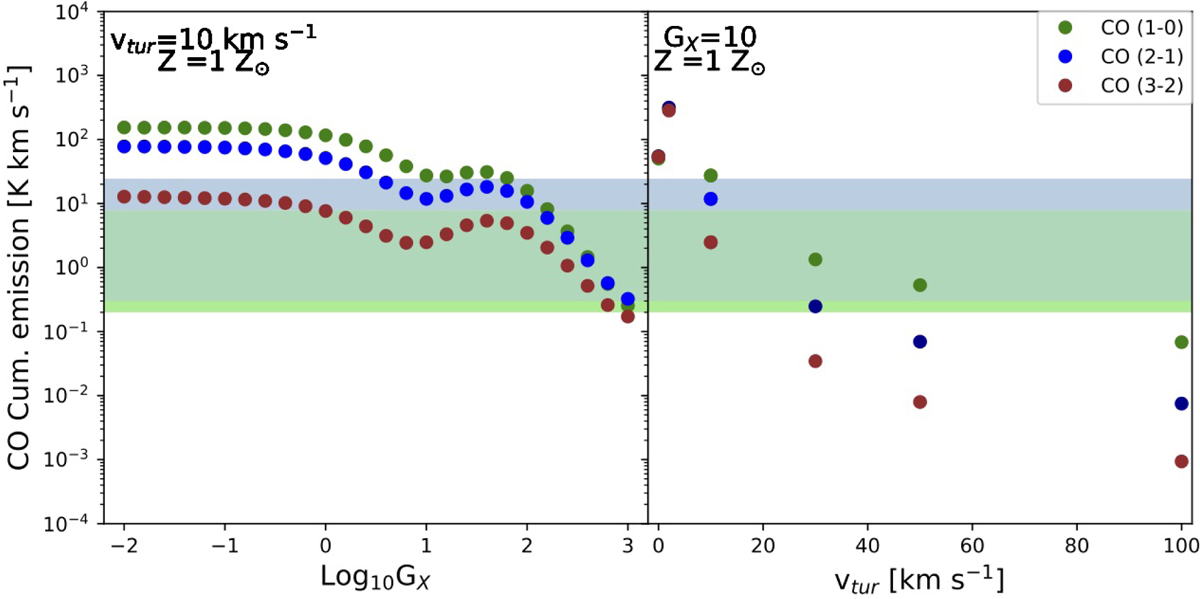
Comparison of observed (green and blue background) and predicted cumulative CO emission: 1–0, 2–1, and 3–2. The predicted values are for AV = 30 mag (end of the cloud). Panel on the left: predicted values as a function of GX for models with turbulence of 10 km s−1 and solar metallicity. Panel on the right: predicted values as a function of turbulence for models with GX = 10 and solar metallicity.
Current usage metrics show cumulative count of Article Views (full-text article views including HTML views, PDF and ePub downloads, according to the available data) and Abstracts Views on Vision4Press platform.
Data correspond to usage on the plateform after 2015. The current usage metrics is available 48-96 hours after online publication and is updated daily on week days.
Initial download of the metrics may take a while.