Fig. 7.
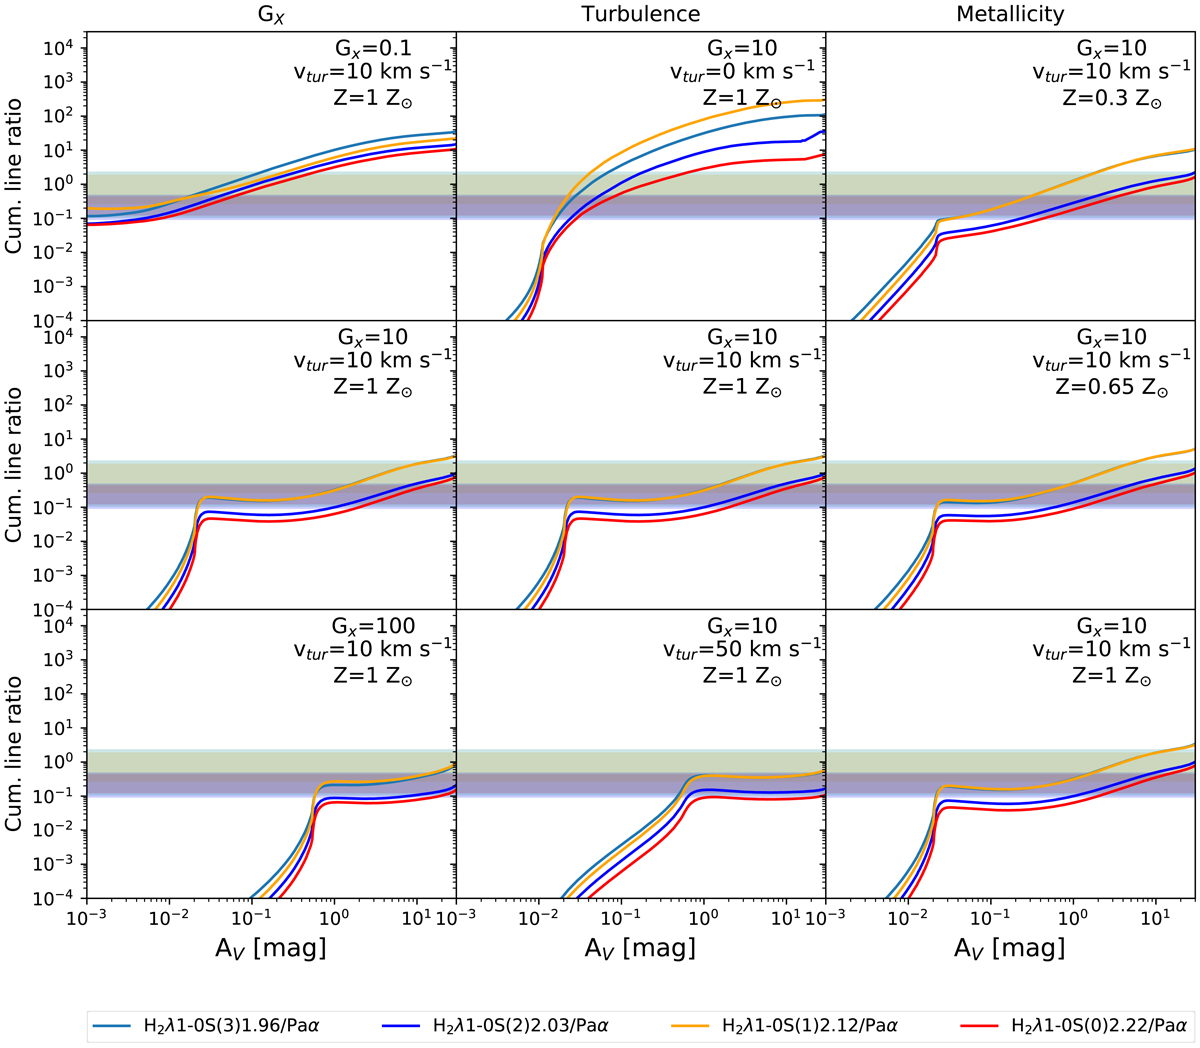
Comparison of observed and predicted ro-vibrational H2 lines, normalized by Paα, as a function of AV for the models described in Sect. 2.2. The different background highlights the observed ratios, between 0.1 and 2.3 (values from Edge et al. 2002). For each ratio, the color of the background and that of the corresponding theoretical cumulative ratio are the same. Column on the left: predicted cumulative emission for models with turbulence of 10 km s−1, solar metallicity, and various values of GX: 0.1 (top), 10 (middle), and 100 (bottom); central column: predicted cumulative emission for models with GX = 10, solar metallicity, and various values of turbulence: 0 (top), 10 (medium), and 50 (bottom) km s−1; column on the right: predicted cumulative emission for models with turbulence 10 km s−1, GX = 10, and various values of metallicity: 0.3 (top), 0.65 (middle), and 1 (bottom) Z⊙.
Current usage metrics show cumulative count of Article Views (full-text article views including HTML views, PDF and ePub downloads, according to the available data) and Abstracts Views on Vision4Press platform.
Data correspond to usage on the plateform after 2015. The current usage metrics is available 48-96 hours after online publication and is updated daily on week days.
Initial download of the metrics may take a while.