Fig. 6.
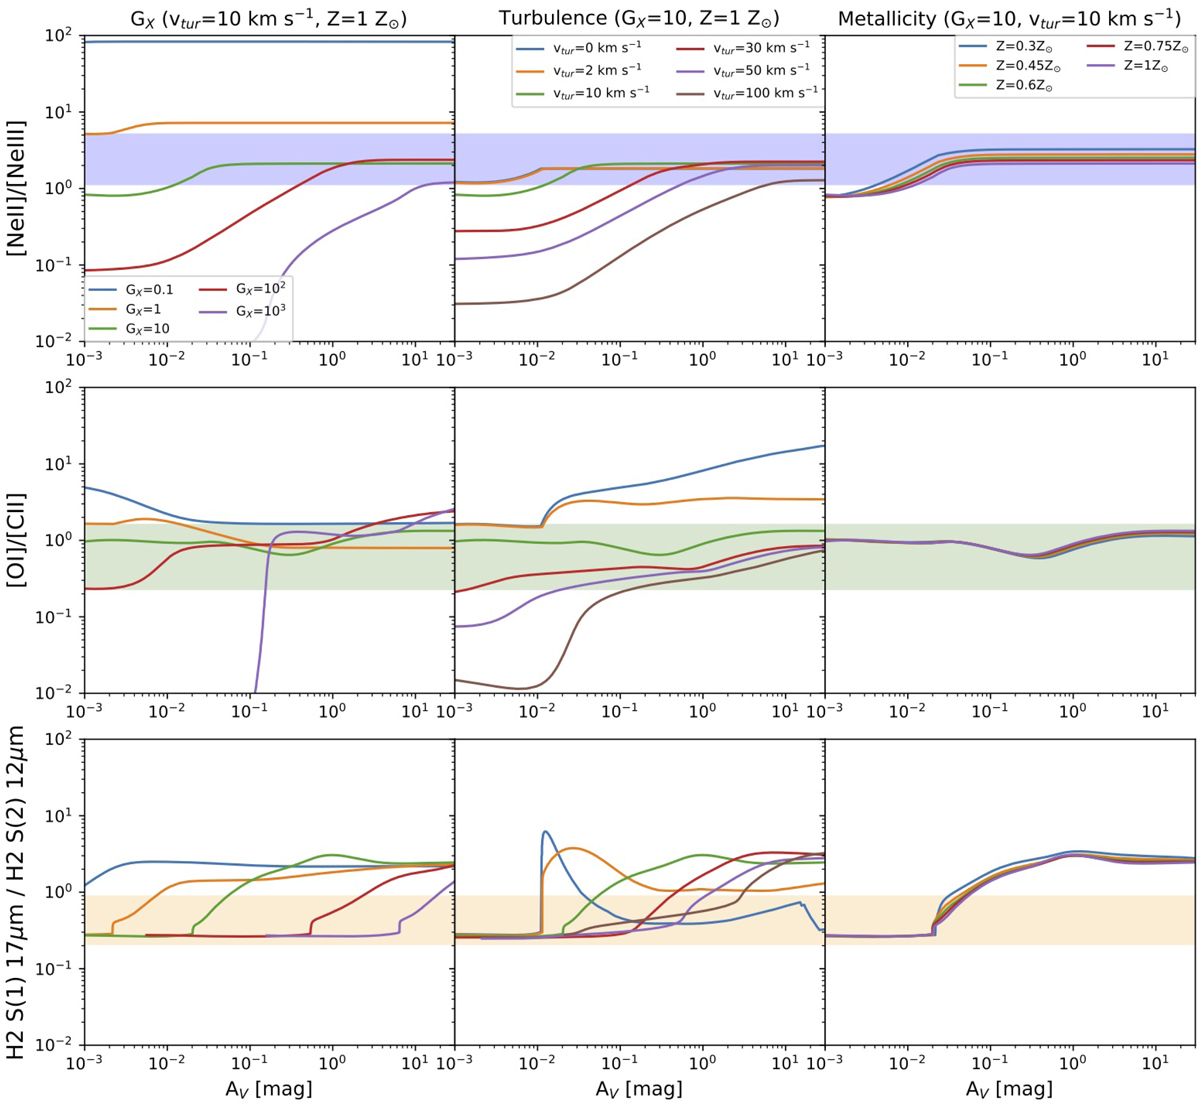
Comparison of observed and predicted cumulative line ratios: [NeII]/[NeIII] (top), [O I]λ 63.2 μm/[C II]λ 157.7 μm (middle), and H2 S(1) 17.0 μm/H2 S(2) 12.3 μm (bottom), as a function of AV. The blue background highlights the observed line ratio of [NeII]/[NeIII], with values between 1.10 and 5.25 (data from Donahue et al. 2011, Egami et al. 2006, and Johnstone et al. 2007). The observed line ratio [O I]λ 63.2 μm/[C II]λ 157.7 μm ranges between 0.22 and 1.64 (values from Edge et al. 2010, Mittal et al. 2011, 2012, and Werner et al. 2014), and is shown in green, and the yellow background highlights the observed ratio of the two pure rotational H2 lines, between 0.2 and 0.9 (values from Donahue et al. 2011, Egami et al. 2006, and Johnstone et al. 2007). Column on the left: predicted ratios for models with vtur = 10 km s−1 and solar metallicity, central column: predicted ratios for models with GX = 10 and solar metallicity, and column on the right: predicted ratios for models with vtur = 10 km s−1 and GX = 10.
Current usage metrics show cumulative count of Article Views (full-text article views including HTML views, PDF and ePub downloads, according to the available data) and Abstracts Views on Vision4Press platform.
Data correspond to usage on the plateform after 2015. The current usage metrics is available 48-96 hours after online publication and is updated daily on week days.
Initial download of the metrics may take a while.