Fig. 5.
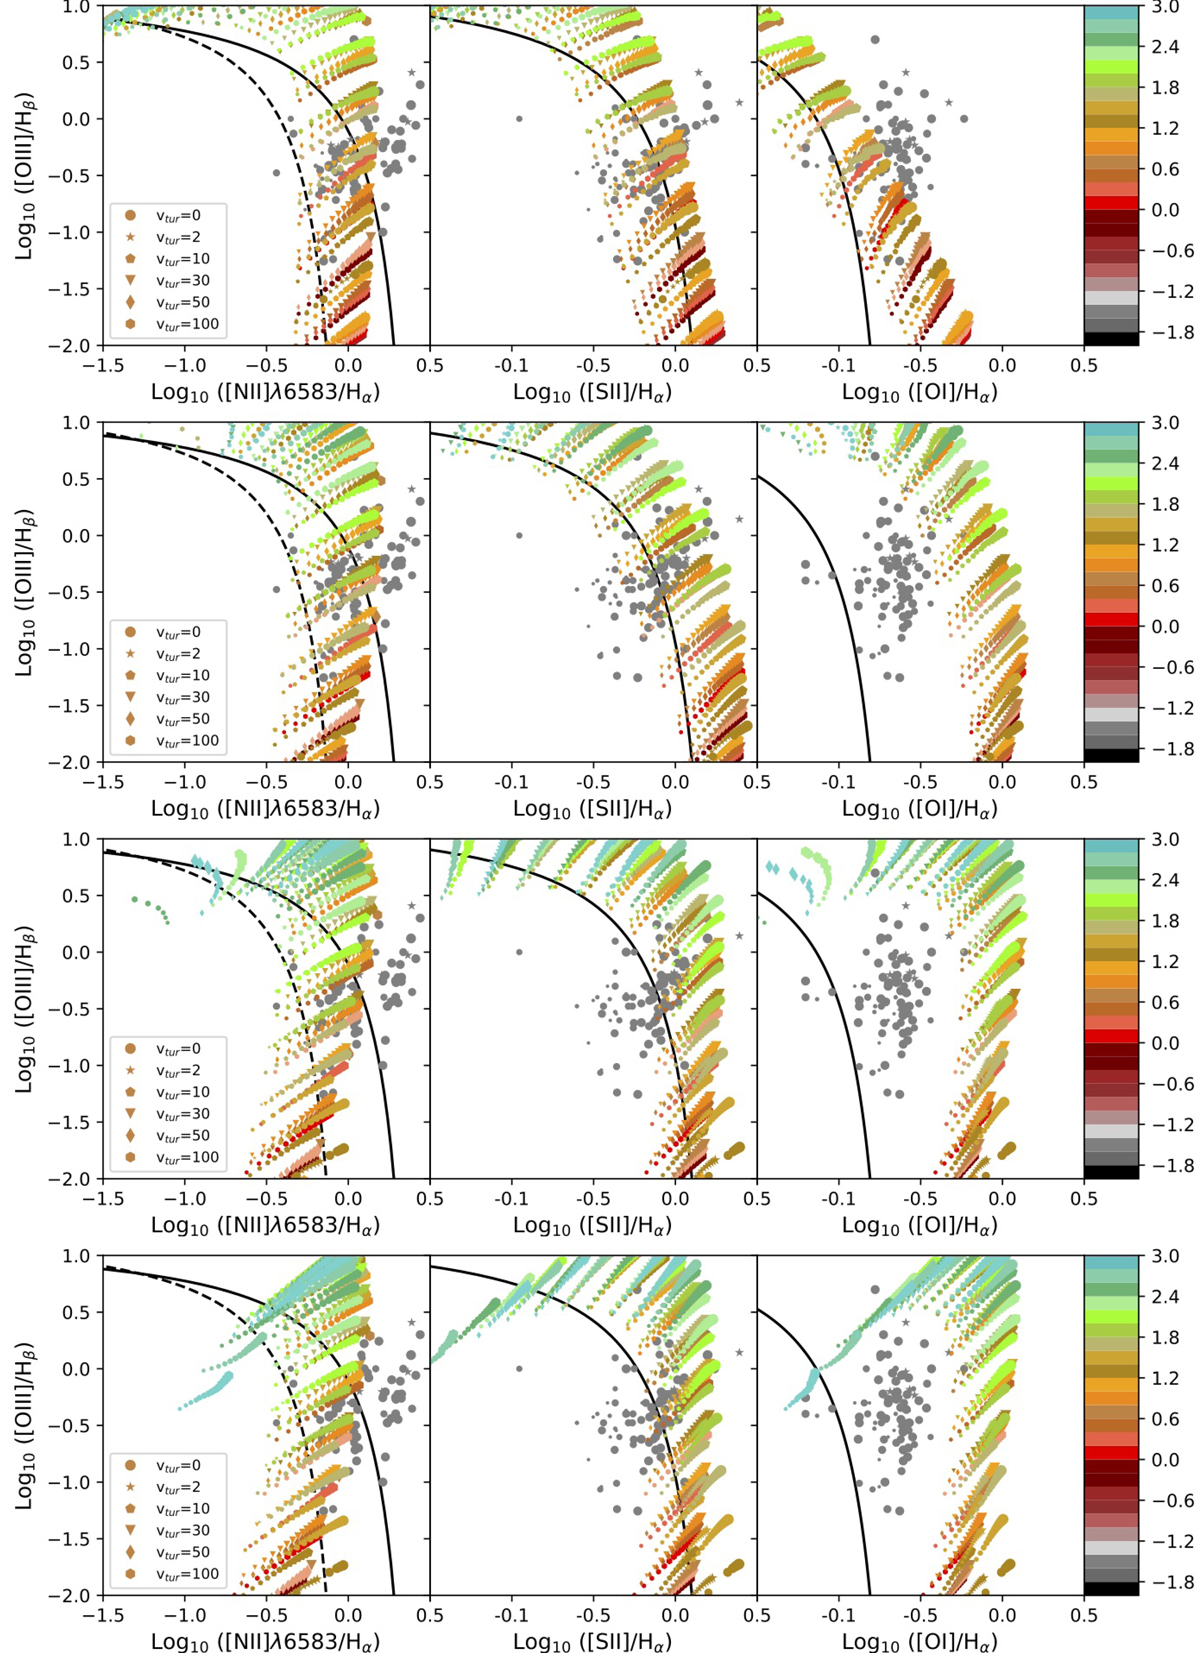
BPT diagrams. The gray dots (filament values) and the stars (nucleus values) represent the data from Mcdonald et al. (2012). The size of the dots decreases with increasing distance of the corresponding object from the nuclei. The solid black line is the upper limit for HII regions by Kewley et al. (2001) and the dashed black line is the lower limit for AGNs by Kauffmann et al. (2003). The predicted cumulative line ratios from the models are overlapped. The color bar corresponds to the different values of GX (the logarithm of the value is written on the bar); each symbol corresponds to one turbulence value and the size of the symbols increases with the metallicity (from 0.3 to 1 Z⊙). Top row: cumulative emission at AV = 0.001 mag; second row: cumulative emission at AV = 0.1 mag; third row: cumulative emission at AV = 1 mag; bottom row: cumulative emission at AV = 5 mag. Left column: [O III]λ 5007 Å/Hβ vs. [N II]λ 6583 Å/Hα; central column: [O III]λ 5007 Å/Hβ vs. [S II]/Hα; right column: [O III]λ 5007 Å/Hβ vs. [O I]/Hα.
Current usage metrics show cumulative count of Article Views (full-text article views including HTML views, PDF and ePub downloads, according to the available data) and Abstracts Views on Vision4Press platform.
Data correspond to usage on the plateform after 2015. The current usage metrics is available 48-96 hours after online publication and is updated daily on week days.
Initial download of the metrics may take a while.