Fig. 1.
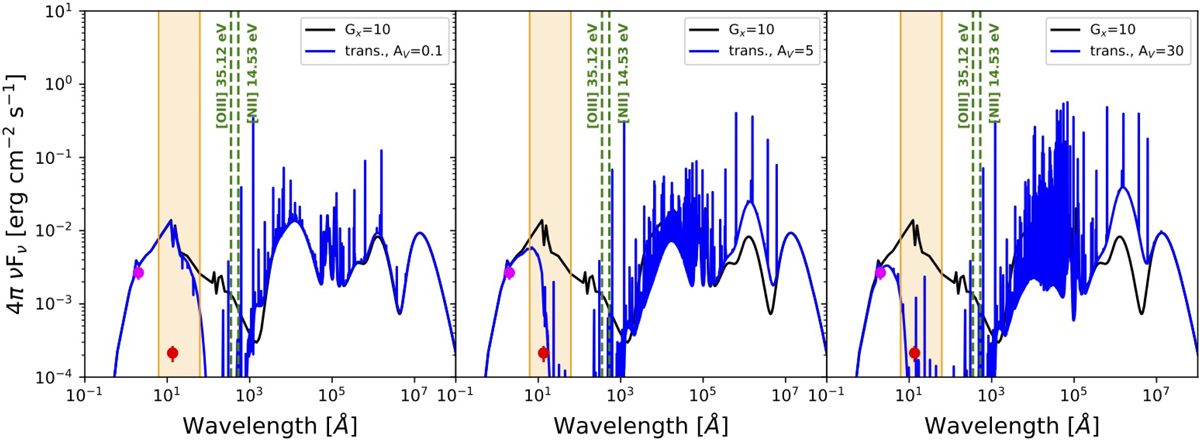
Spectral energy distribution of the input radiation field for GX = 10 (black line) and the total outward radiation field (continuum and line emission) stopping the model at different AV (blue line): 0.1, 5, and 30 mag. The two vertical green lines show the energy necessary to create O++ and N+, two of the ions whose emission is used to constrain the modeling. The dots represent the average observed integrated flux for the filaments surrounding NGC 1275 of 4.0 × 10⁻¹⁶ erg cm−2 s−1 arcsec−2 in the 0.6–2.0 keV band (red dot; Walker et al. 2015) and of 5 × 10⁻¹⁵ erg cm−2 s−1 arcsec−2 in the 2–10 keV band (magenta dot; Sanders et al. 2005). The orange background highlights the range over which the integrated intensity is calculated to scale GX.
Current usage metrics show cumulative count of Article Views (full-text article views including HTML views, PDF and ePub downloads, according to the available data) and Abstracts Views on Vision4Press platform.
Data correspond to usage on the plateform after 2015. The current usage metrics is available 48-96 hours after online publication and is updated daily on week days.
Initial download of the metrics may take a while.