Fig. 4
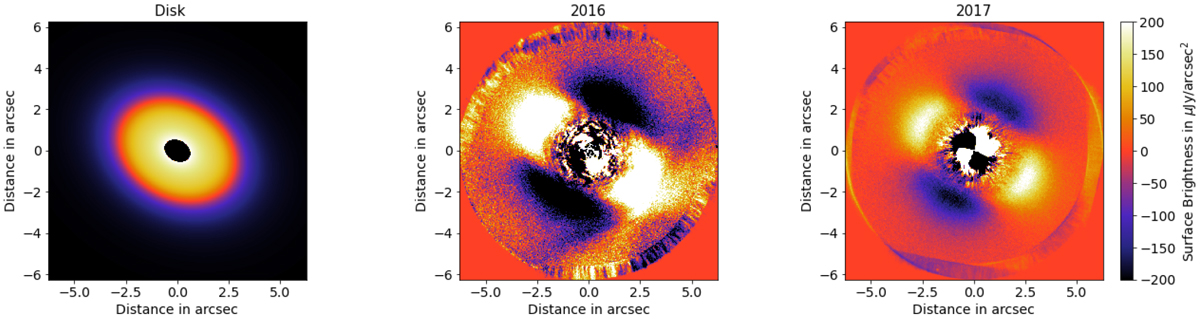
Simulation of the disk injected in the 2016 and 2017 data sets. The synthetic disk as described by Marino et al. (2020) is shown on the left. The images processed with cADI including the injected disk are shown in the center and on the right for the 2016 and 2017 data sets, respectively. This illustration corresponds to a disk with an albedo equal to 0.9 in the K band (2016) and an albedo equal to 0.7 in the H band (2017).
Current usage metrics show cumulative count of Article Views (full-text article views including HTML views, PDF and ePub downloads, according to the available data) and Abstracts Views on Vision4Press platform.
Data correspond to usage on the plateform after 2015. The current usage metrics is available 48-96 hours after online publication and is updated daily on week days.
Initial download of the metrics may take a while.