Fig. B.1.
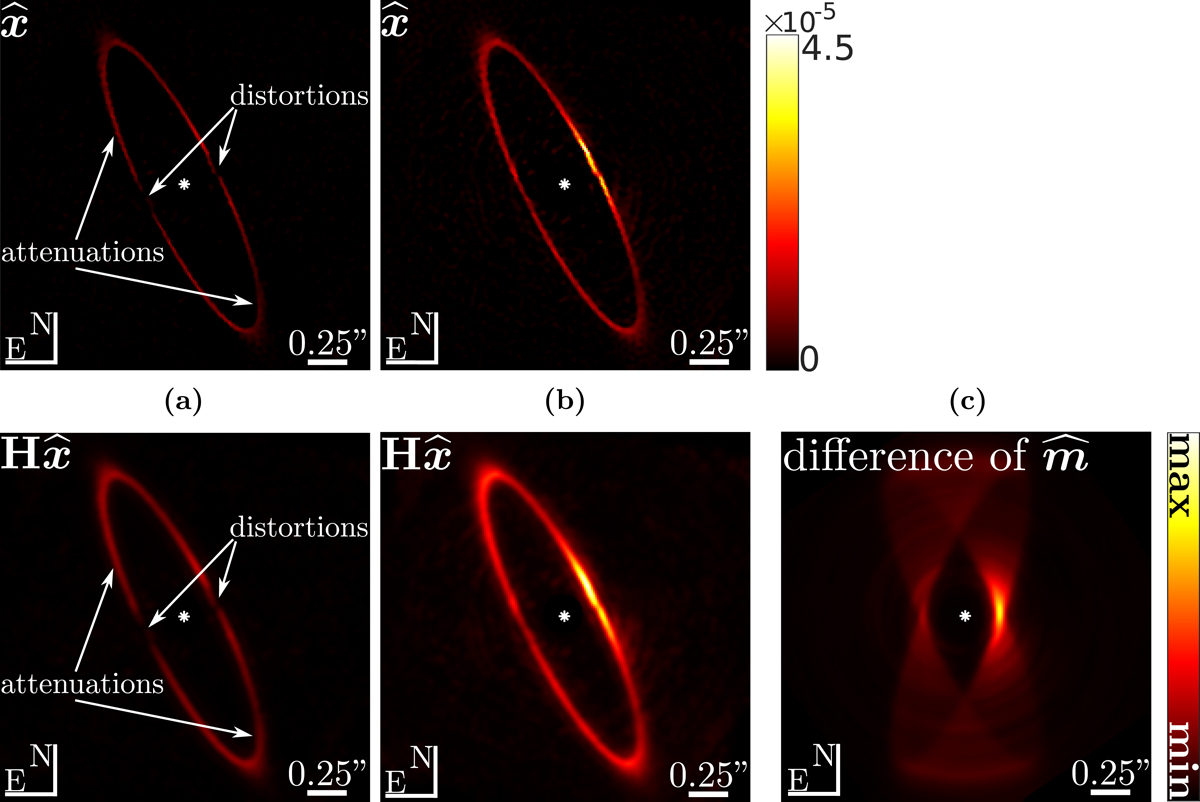
Illustration of the influence of the statistics ![]() of the nuisance component on the REXPACO reconstructions. (a)
of the nuisance component on the REXPACO reconstructions. (a) ![]() is computed with Eqs. (2.4) ignoring the contribution of the object; (b)
is computed with Eqs. (2.4) ignoring the contribution of the object; (b) ![]() is computed with Algorithm 1; (c) difference of the mean component
is computed with Algorithm 1; (c) difference of the mean component ![]() estimated with Eq. (14a) and Algorithm 1. For (a) and (b), both the deconvolved flux distribution
estimated with Eq. (14a) and Algorithm 1. For (a) and (b), both the deconvolved flux distribution ![]() and its convolved version
and its convolved version ![]() are given. The difference of estimated means
are given. The difference of estimated means ![]() given in (c) is represented with the same colorbar than the convolved objects
given in (c) is represented with the same colorbar than the convolved objects ![]() given in (a) and (b) to ease comparisons. Data set: HR 4796A, see Sect. 3.3.1 for observing conditions.
given in (a) and (b) to ease comparisons. Data set: HR 4796A, see Sect. 3.3.1 for observing conditions.
Current usage metrics show cumulative count of Article Views (full-text article views including HTML views, PDF and ePub downloads, according to the available data) and Abstracts Views on Vision4Press platform.
Data correspond to usage on the plateform after 2015. The current usage metrics is available 48-96 hours after online publication and is updated daily on week days.
Initial download of the metrics may take a while.