Fig. 9.
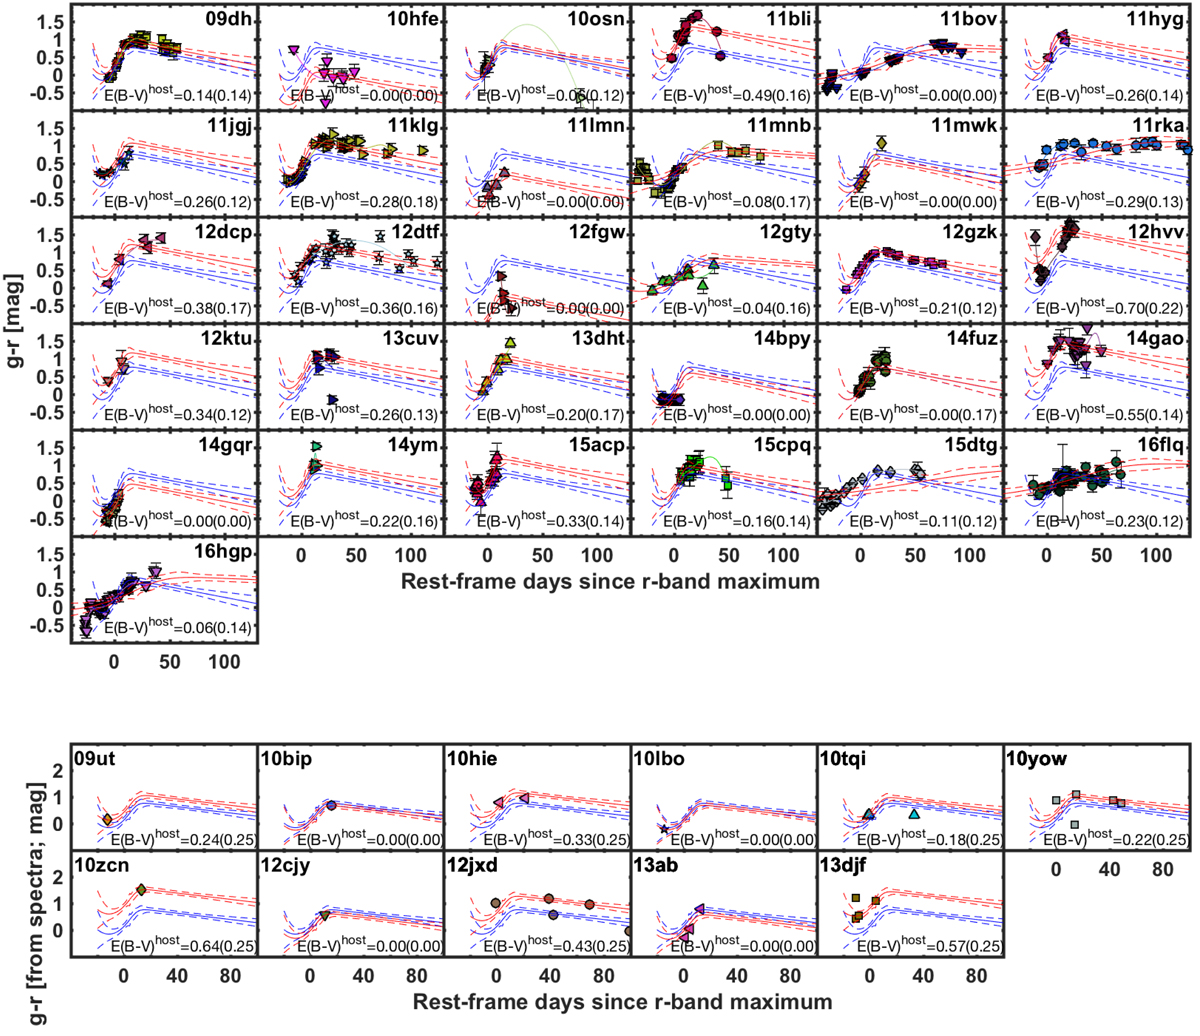
Upper panel: individual (MW corrected) g − r color evolution for 31 SNe from photometry with the polynomial fits represented as solid lines. The red lines represent the fit of the data with the g − r template. The blue line is the template for a Type Ic with no extinction from Stritzinger et al. (2018), and each panel shows the reddening in E(B − V) required to shift the color curve to the data. This represents the estimated host extinction measured in magnitudes. Bottom panel: same as above for the 11 SNe where the colors are calculated from spectroscopy.
Current usage metrics show cumulative count of Article Views (full-text article views including HTML views, PDF and ePub downloads, according to the available data) and Abstracts Views on Vision4Press platform.
Data correspond to usage on the plateform after 2015. The current usage metrics is available 48-96 hours after online publication and is updated daily on week days.
Initial download of the metrics may take a while.