Free Access
Fig. 5.
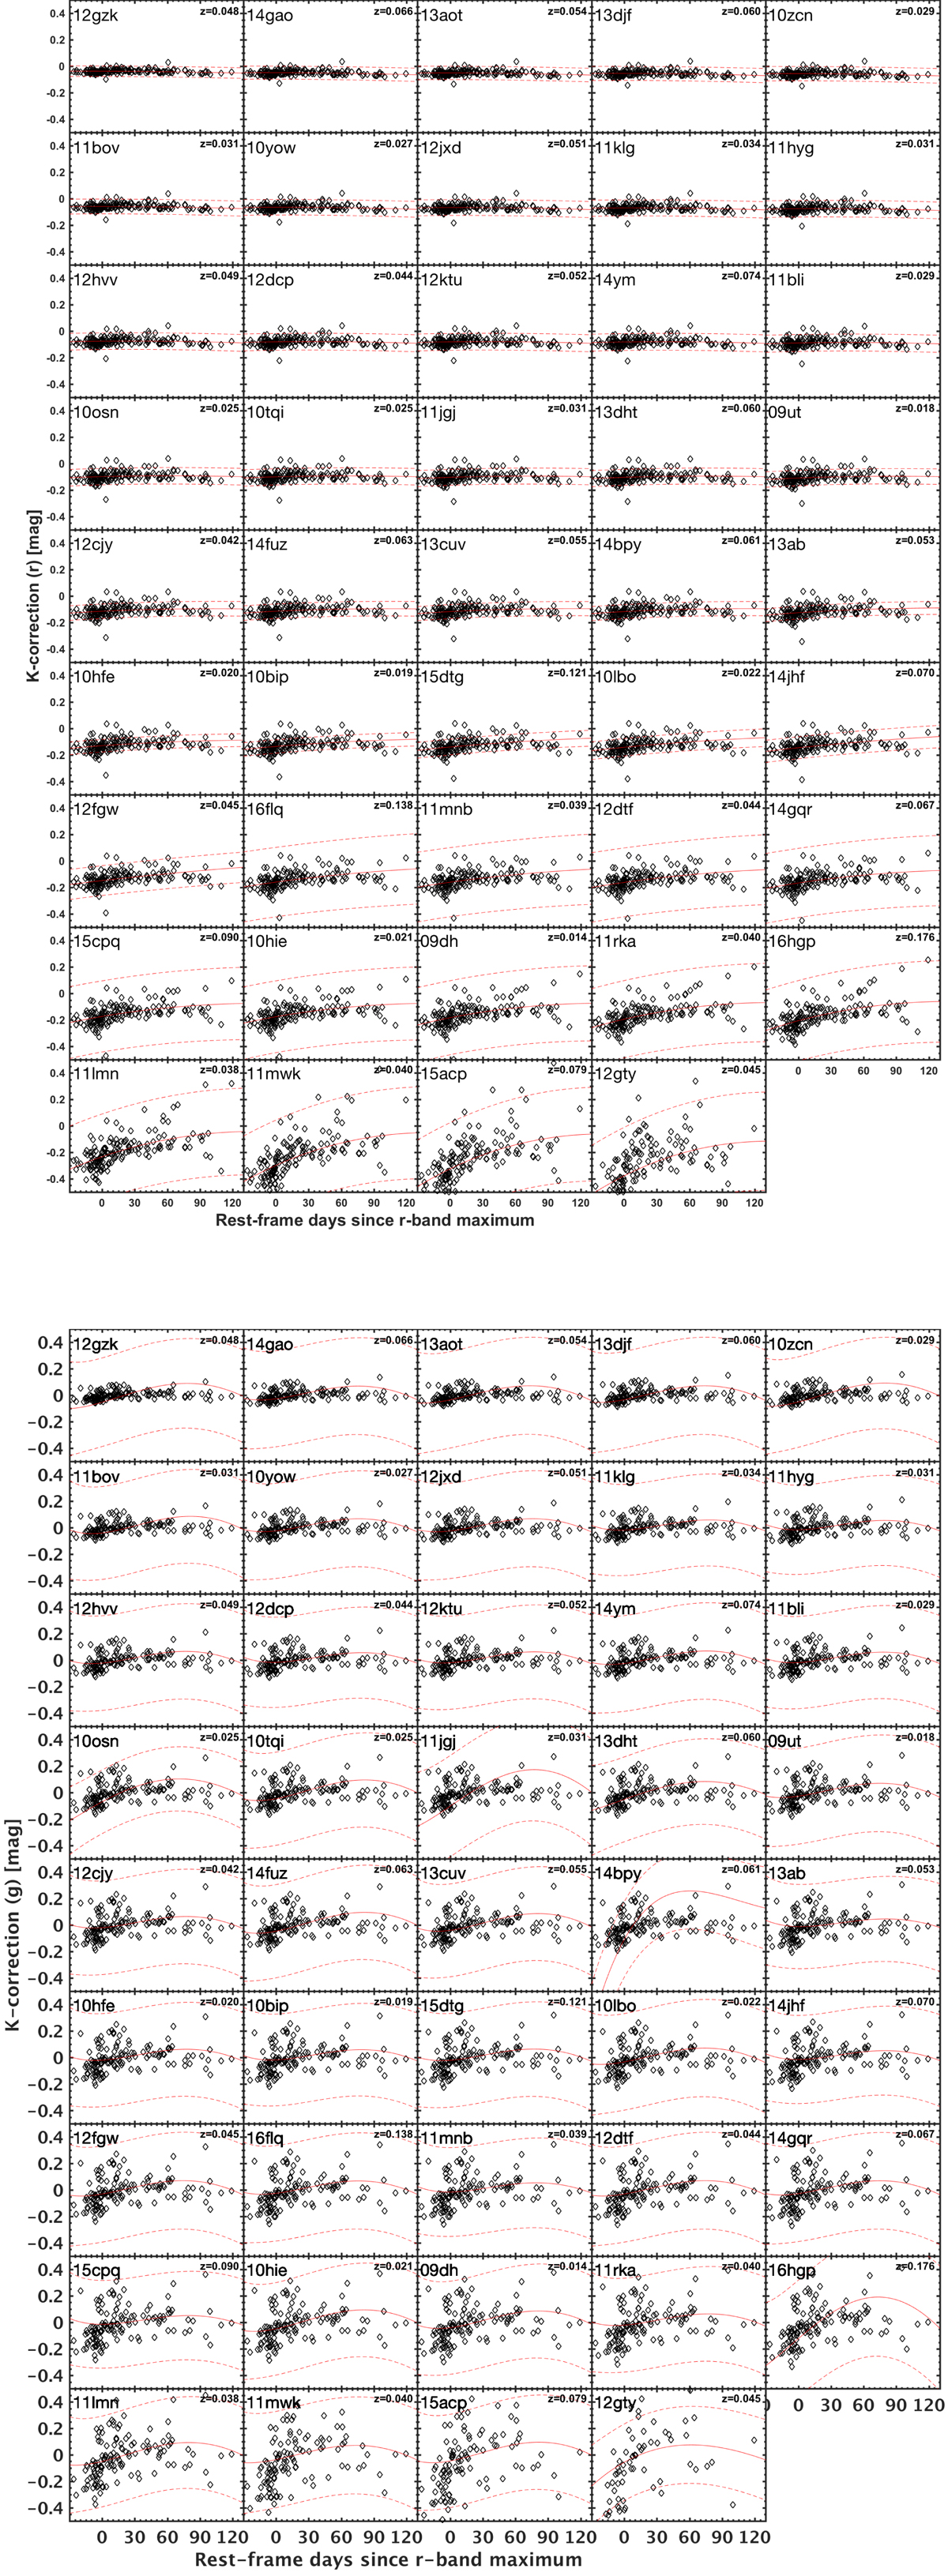
K-corrections in the r band for our SN sample. The solid red line represents the second order polynomial fit, whereas the red dashed lines show the 1σ uncertainties. The SNe have been ordered according to increasing redshift.
Current usage metrics show cumulative count of Article Views (full-text article views including HTML views, PDF and ePub downloads, according to the available data) and Abstracts Views on Vision4Press platform.
Data correspond to usage on the plateform after 2015. The current usage metrics is available 48-96 hours after online publication and is updated daily on week days.
Initial download of the metrics may take a while.