Fig. 4.
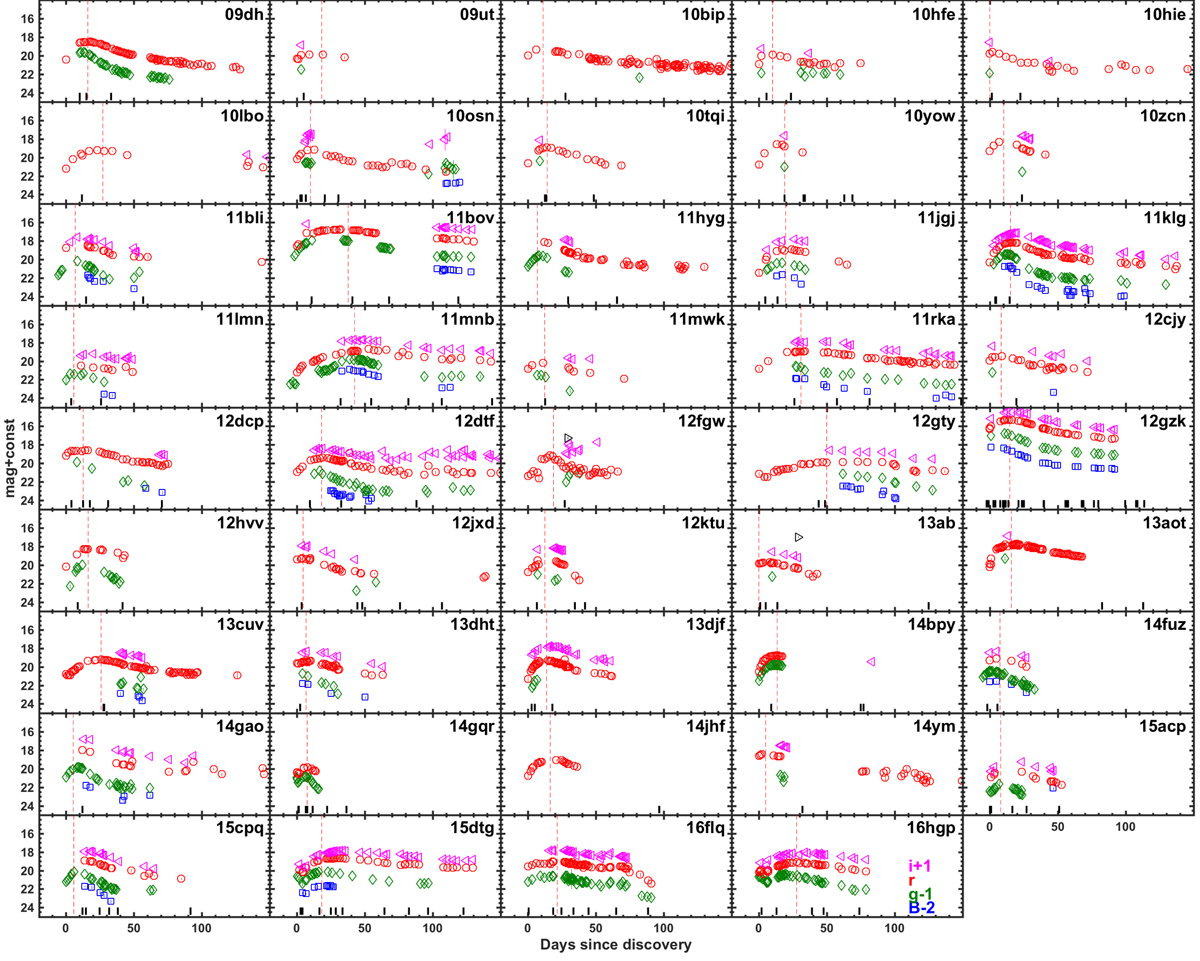
Light curves in B, g, r, i of the 44 SNe Ic for which we have pre-maximum observations. We plot the apparent magnitude as a function of days since discovery. Shifts have been applied for clarity, as indicated in the legend in the bottom row. The peak epoch is shown as a dashed red line. The black dashed lines at the bottom represent epochs of spectral observations.
Current usage metrics show cumulative count of Article Views (full-text article views including HTML views, PDF and ePub downloads, according to the available data) and Abstracts Views on Vision4Press platform.
Data correspond to usage on the plateform after 2015. The current usage metrics is available 48-96 hours after online publication and is updated daily on week days.
Initial download of the metrics may take a while.