Free Access
Fig. 3.
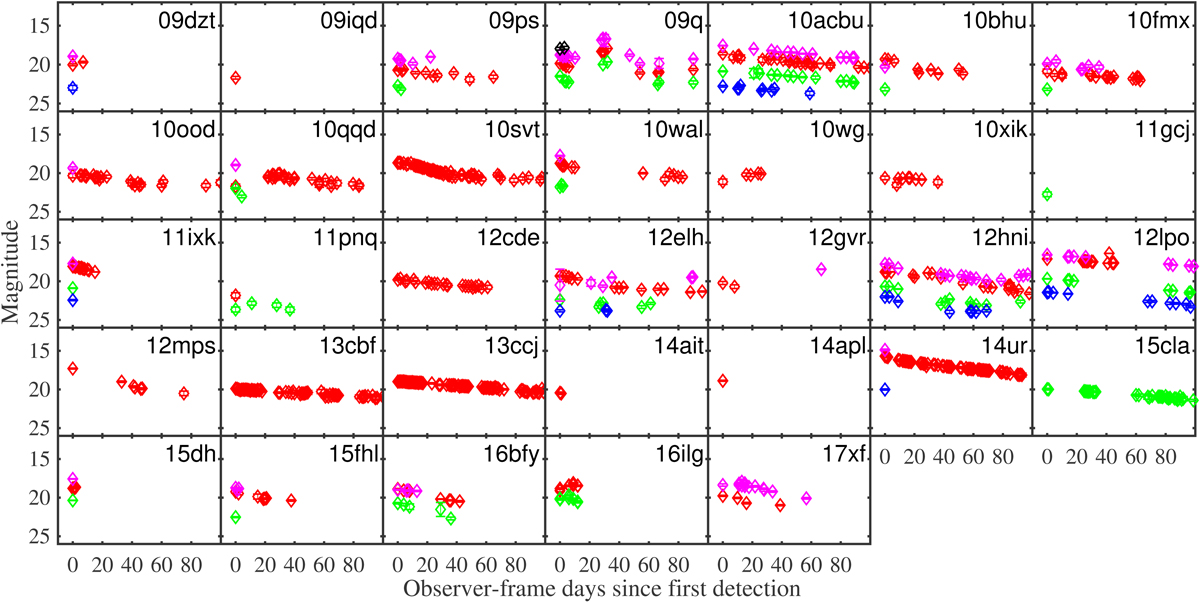
Light curves for all the 33 SNe Ic and Ibc in (i)PTF which do not show an observed peak and will not be included in the overall analysis. We plot the apparent magnitude as a function of time since first detection, in the observer’s frame. Shifts have been applied for clarity as indicated in the legend in the bottom row.
Current usage metrics show cumulative count of Article Views (full-text article views including HTML views, PDF and ePub downloads, according to the available data) and Abstracts Views on Vision4Press platform.
Data correspond to usage on the plateform after 2015. The current usage metrics is available 48-96 hours after online publication and is updated daily on week days.
Initial download of the metrics may take a while.