Fig. 17.
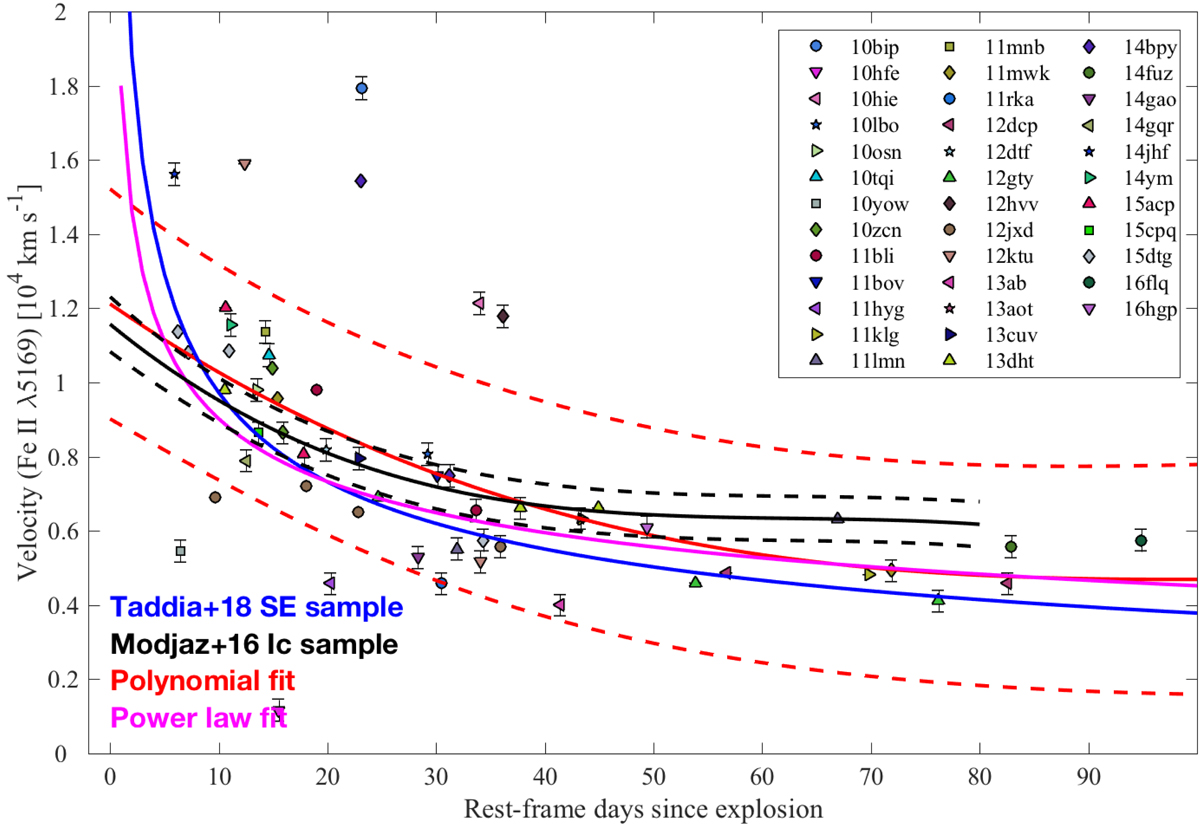
Fe II λ5169 velocity evolution for 37 SNe Ic from the sample (see Sect. 6 for the selection criteria). The magenta solid line represents the power law that fits the evolution with time. The blue solid line represents the trend found by Taddia et al. (2018b) and is similar to the one found in this work. The black lines represent the polynomial fit found by Modjaz et al. (2016). As a comparison, we fitted the data also with a polynomial fit, here shown in red.
Current usage metrics show cumulative count of Article Views (full-text article views including HTML views, PDF and ePub downloads, according to the available data) and Abstracts Views on Vision4Press platform.
Data correspond to usage on the plateform after 2015. The current usage metrics is available 48-96 hours after online publication and is updated daily on week days.
Initial download of the metrics may take a while.