Fig. 14.
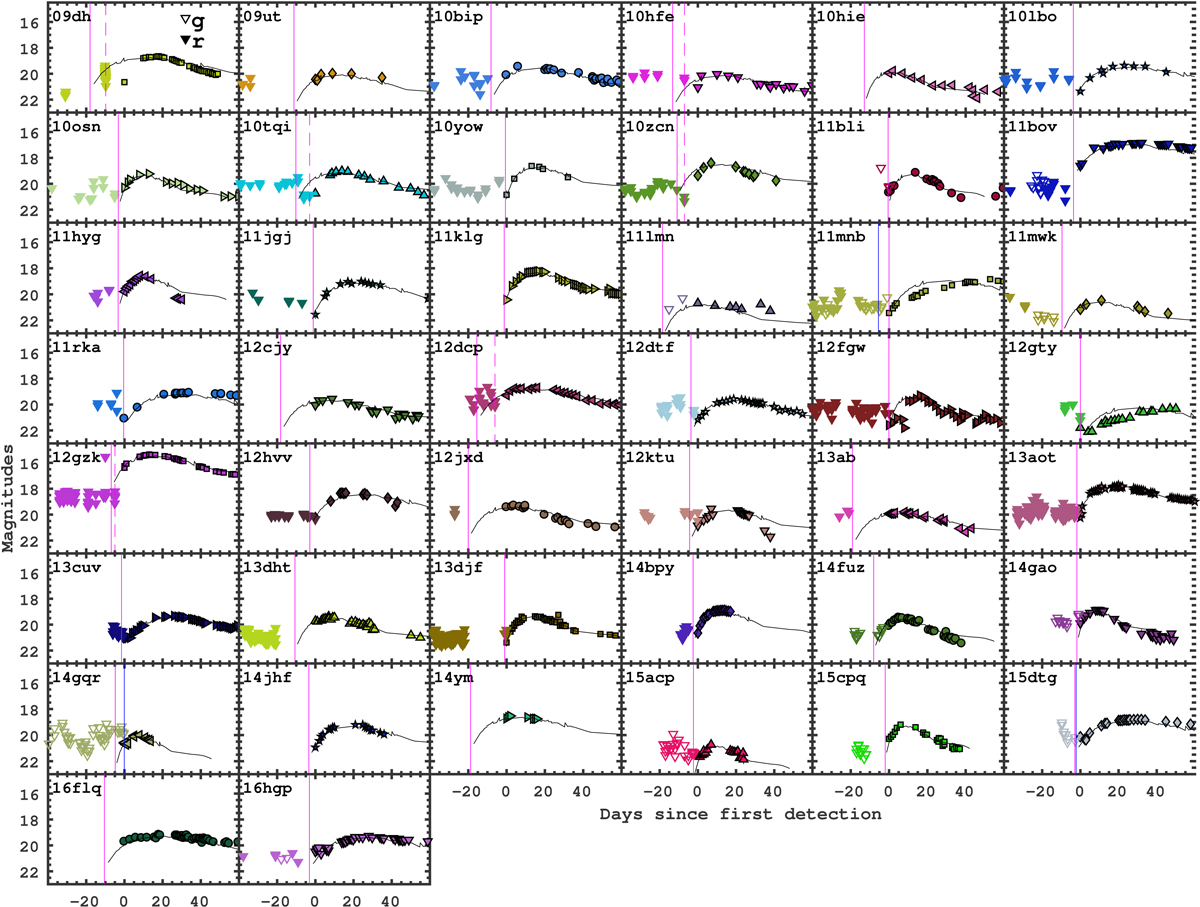
Fit of the light curve of iPTF13djf to the other SNe of the sample to estimate the explosion epoch. The open symbols represents the pre-explosion limits. Solid magenta lines represent the explosion epochs estimated from the fit. Dashed magenta lines represent the last non-detection assumed as explosion epoch. Blue solid lines represent explosion epochs available from literature.
Current usage metrics show cumulative count of Article Views (full-text article views including HTML views, PDF and ePub downloads, according to the available data) and Abstracts Views on Vision4Press platform.
Data correspond to usage on the plateform after 2015. The current usage metrics is available 48-96 hours after online publication and is updated daily on week days.
Initial download of the metrics may take a while.